article thumbnail

Capitalizing on the Voice of the Customer (Infographic)

Experience Matters

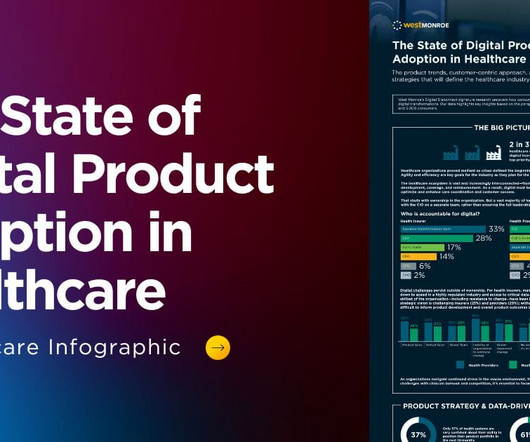
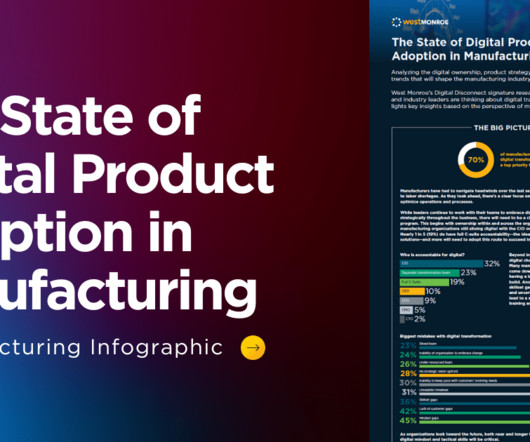
That’s why Temkin Group put together this infographic with insights from our research. Here’s a poster version and you can see the full infographic below. Here are links to download versions of the infographic: Poster (18′ x 24″) in.pdf file or in.png file. Infographic in.pdf file or in.png file.

article thumbnail

Home Isn’t Always Where the Heart Is: Social Sentiment of Vacation Destinations [INFOGRAPHIC]

NetBase

Let’s use social analytics to find out! And that’s the beauty of social analytics – making discoveries beyond the obvious. If your business is travel, there’s a lot more information worth checking out in our Destination Vacation infographic below. Want to learn more about the value of sentiment in your social analytics?

Insiders

Sign Up for our Newsletter

This site is protected by reCAPTCHA and the Google Privacy Policy and Terms of Service apply.

article thumbnail

Key Findings from our Accounting & Tax Services Study [Infographic]

PeopleMetrics

Check out the infographic for the rest of the results: PeopleMetrics provides CEM software and CX expertise to help companies measure, act on and improve the customer experience. We help companies make sense of their CX data through hands-on analytical support and advanced machine learning solutions.

article thumbnail

What CX Intelligence reveals about the men’s apparel market (infographic)

ForeSee

The post What CX Intelligence reveals about the men’s apparel market (infographic) appeared first on ForeSee. Over the last decade, the men’s apparel market has shown steady growth, outpacing even women’s apparel, and is expected to contribute upwards of $40 billion in sales to the global.

Apparel 67
article thumbnail

Local SEO: Tips & Strategies to Get Discovered

InMoment XI

Track and Measure Results Use analytics tools to track the performance of your local content marketing efforts, including website traffic, engagement metrics, and conversions. Incorporate feedback and suggestions from your audience into future content ideas to ensure that your content remains relevant and valuable to your local community.

Tips 260
article thumbnail

3 Most Common CX Metrics Questions (And Their Answers)

InMoment XI

Check out this infographic! So, you try structural equation modeling, key driver analysis, or heavy duty analytics. Instead, you want to break methodology down to core factors—using statistical analysis or text analytics—to see what themes come out and categorize them according to where your organization is.

Metrics 260
article thumbnail

Converse 2022

Uniphore

Infographics. Speech Analytics. Analyze Analytics and insights from 100% of interactions across all channels. Sylvain has been at the forefront of digitizing the customer acquisitions process and introducing AI and analytics-based sales motion. U-Self Serve. Case Studies. White Papers. Conversational AI. Emotion AI.