article thumbnail

Mastering Customer Experience Metrics (Infographic)

Experience Matters

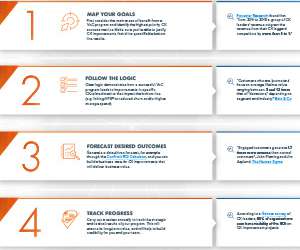
As an organization’s customer experience efforts mature, CX metrics become a critical guidepost for all of its activities. You can see different ways to download this infographic below. Here are links to download different versions of the infographic: Infographic: in .png png format, in .pdf pdf format 18?

article thumbnail

The Ultimate Customer Experience Infographic, 2014

Experience Matters

In honor of Customer Experience Day, Temkin Group created its second annual “The State of Customer Experienceinfographic. You can see a vertical infographic below or: Click here to download the vertical infographic (.pdf). 2014 Temkin Experience Ratings.

Insiders

Sign Up for our Newsletter

This site is protected by reCAPTCHA and the Google Privacy Policy and Terms of Service apply.

article thumbnail

ROI of Customer Experience (Infographic)

Experience Matters

People always ask about the connection between customer experience and business results. In this infographic, we share data from the Temkin Group research report, ROI of Customer Experience 2015. Filed under: Customer experience , Infographic , ROI of Customer Experience.

article thumbnail

4 Reads That Will Help You Prove CX ROI

InMoment XI

At the end of the day, investing in customer experience (CX) is about more than just the score. Creating tangible value for your business—and that means proving that sometimes elusive CX ROI. Four Ways to Prove CX ROI (and Assets That Show You How). 1: Customer Acquisition. 2: Customer Retention.

ROI 260
article thumbnail

Collage of 2018 Customer Experience Infographics (So Far)

Experience Matters

We’re always looking for ways to share interesting data and concepts, so we regularly publish parts of our content in infographics. In case you’ve missed any of them, here’s a collage of the infographics that we’ve already published this year.

article thumbnail

15 Factoids: CX Efforts & ROI (Infographic)

Experience Matters

It’s hard to keep up with everything that Temkin Group published in 2017, so we put together a couple of infographics to highlight some of the key data insights. This first infographic looks at CX efforts and the ROI of those activities. Here are links to download different versions of the infographic: Infographic: in .jpg

article thumbnail

The Ultimate Customer Experience Infographic, 2016

Experience Matters

Once again, Temkin Group is publishing a new infographic as part of our CX Day celebration. Take a look at last year’s ultimate CX infographic.