Remove descriptive-analysis
article thumbnail

Unveiling Integrated CX Part 2: Richest Insights for Transformative Results

InMoment XI

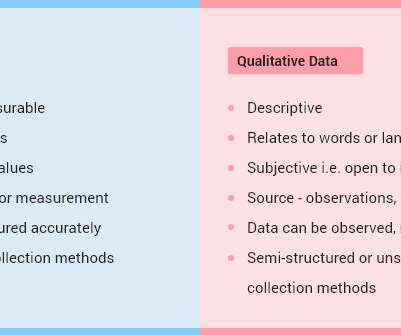
Now that we’ve explored capturing Strongest Signals in our previous blog post , it’s time to dive into the heart of Integrated CX—unlocking the Richest Insights. Every customer comment, whether from emails, social media, or customer service interactions, can be dissected for sentiment and emotion analysis.

article thumbnail

The Importance of Establishing Credibility in Qualitative Research

2020 Research

Strategies to build credibility in your qualitative research include triangulation, member checking, peer debriefing, thick description, reflexivity, saturation, and external audits. However, the credibility of qualitative research findings is often questioned due to the subjective nature of data collection and analysis.

Study 98
Insiders

Sign Up for our Newsletter

This site is protected by reCAPTCHA and the Google Privacy Policy and Terms of Service apply.

article thumbnail

Statistical Treatment of Data for Survey: The Right Approach

SurveySparrow

This blog post will give a short overview of the statistical treatment of data and how it can be used to improve your business. Descriptive Statistics. Descriptive statistics are used to describe the overall characteristics of a dataset. Descriptive statistics can be used to generate summary reports of survey data.

Survey 52
article thumbnail

Transforming Marketing with AI Tools

Magellan Solutions

AI gives marketers the ability to: Process vast amounts of data quickly Extract valuable insights Uncover hidden patterns Businesses can understand their target market using AI-driven customer profiles and sentiment analysis. Social listening and sentiment analysis are two benefits of natural language processing (NLP).

Tools 98
article thumbnail

Modernizing data science lifecycle management with AWS and Wipro

AWS Machine Learning

Flow description for the automated training pipeline The above diagram is an automated training pipeline built using Step Functions, Lambda, and SageMaker. Figure 7 – Model monitor step machine Flow description for the custom model monitor pipeline: The pipeline runs according to the defined schedule configured through EventBridge.

Data 107
article thumbnail

Generative AI and multi-modal agents in AWS: The key to unlocking new value in financial markets

AWS Machine Learning

Technical challenges with multi-modal data further include the complexity of integrating and modeling different data types, the difficulty of combining data from multiple modalities (text, images, audio, video), and the need for advanced computer science skills and sophisticated analysis tools.

article thumbnail

How to Improve Your Customer Satisfaction Score (CSAT) Score

GetFeedback

Take a look at your analysis toolbox and go beyond simple descriptive analytics and quadrant charts; use predictive and prescriptive analytics in order to identify the next best action to take to ensure the customer achieves her desired outcome, how much effort to put forth, and what the impact is on the customer and the business.