
Open Ended Survey Questions: How to Code & Analyze for Insights
How much time have you spent (let’s be honest: wasted) scrolling through endless Excel spreadsheets full of open-ended question data, trying to piece together new customer insights?
Contrastingly, closed-ended questions offer a different challenge in analysis, providing structured and easily analyzable data that starkly contrasts with the open-ended questions’ complexity. Closed-ended questions are effective for topics or constructs that are clearly defined, while open-ended questions are more suitable for complex or 'fuzzy' constructs and for gathering authentic feedback and diverse responses.
This type of data is a treasure trove of valuable insights to drive CX improvements. However, it makes no sense to have someone manually checking spreadsheets to discover these insights.
In this post I discuss the alternate ways.
Analyzing open-ended survey questions
You’ll often find the most useful insights by analyzing your open-ended survey questions (such as free-text responses to your Net Promoter Score survey questions), including both quantitative data and the rich, qualitative data from the responses of survey respondents. Open-ended survey responses, especially, offer a deep dive into customer feedback, providing detailed insights that closed-ended questions might miss. But, what if you’re faced with hundreds or thousands of answers? It takes too long and is a huge mental tax!
The answer: coding open-ended questions.
Incorporating data visualization techniques can significantly aid in the analysis process of these open-ended survey responses. By using graphs, thematic coding, and even Microsoft Office tools like PowerPoint and Excel, you can transform these qualitative responses into visually compelling stories. This approach not only streamlines the analysis of open-ended responses but also highlights the importance of balancing these with closed-ended questions for a comprehensive understanding.
Summarizing open-ended survey questions? Start here.
Manual, or automated coding?
There’s ample debate about whether to go for manual or automated coding. It is advisable not to force respondents to provide a detailed response to open-ended questions; instead, give them the option to skip the question or provide a simple negative response.
You can do automated coding with the help of text analytics software (such as Thematic), which is a lot simpler. But if you decide to go for manual coding, you’ll want to learn best practices from the people who have been dealing with text for decades, qualitative researchers. In addition to these methods, focus groups offer a qualitative research alternative that can yield deeper insights compared to open-ended survey questions, by gathering lengthier responses and requiring more effort from participants. This makes focus groups or one-to-one interviews a valuable complement or alternative to manual and automated coding for those looking to dive deeper into qualitative data.
For this post, I’ve dived into how manual coding works.
What is coding and why does it matter?
When you hear a term like ‘big data’, it almost always refers to quantitative data: numbers or categories, which are essential for statistical and machine learning techniques. However, to gain a comprehensive understanding of a subject, incorporating both quantitative and qualitative data is crucial. Closed-ended questions provide structured data that complements the qualitative insights from open-ended questions. This means not only focusing on numbers but also on free text, an example of qualitative data, which is difficult to deal with but essential for uncovering deep customer insights.
By nature, qualitative researchers believe that solely relying on numbers won’t suffice. They advocate for the collection of both quantitative and qualitative data, such as survey responses and opinions, to achieve a more complete analysis. This approach allows for the use of tools and techniques to analyze and visualize data, enhancing the data-driven narrative. They believe that by interviewing (or surveying) your customers and asking them to answer open-ended questions, alongside collecting numerical data, you can gain much deeper learnings.
The value in Net Promoter Score surveys
Let’s take for example Net Promoter Score (NPS) surveys. The score, calculated from numeric answers to the question ‘How likely, on a scale from 0 to 9, are you to recommend us to friend or family?’ will result in a single measure of a company’s performance.
Let’s dig a bit deeper. It’s actually the open-ended answers to the question ‘Why did you give us that score?’ that will teach you how to improve that measure in the future. Simple answers to these open-ended questions are invaluable for understanding customer sentiments and making informed business decisions. These open-ended responses are crucial for gaining a deeper understanding of customer satisfaction and loyalty. They provide detailed and nuanced feedback, leading to a better comprehension of customer experiences and preferences.
As you know, qualitative research produces a lot of text.
Survey questions where respondents are free to write whatever they like are also called open-ended questions. A response is known as a verbatim.
Researchers use coding to draw conclusions from this data with the objective of making data-driven decisions. ‘Coding’ or ‘tagging’ each response with one or more codes helps capture what the response is about, and in turn, summarise the results of the entire survey effectively. If we compare coding to Natural Language Processing (NLP) methods for analyzing text, in some cases coding can be similar to text categorization and in other ways to keyword extraction.
Now, let’s look at coding and the different methodologies in more detail.
Coding frames
We often refer to how to perform the task manually, but if you are looking at using an automated solution, this knowledge will help you understand what matters and how to choose an effective approach. It is also important to avoid forcing respondents to provide a detailed response to open-ended questions; instead, give them the option to skip the question or provide a simple negative response.
What's a coding frame?
When creating codes, they’re put into what we call a coding frame. Closed-ended questions provide structured data that complements the qualitative insights from open-ended questions. The coding frame is important because it represents the organizational structure and influences how useful the coded results will be. There are two types of frames: ‘flat’ and ‘hierarchical’:
- A Flat frame means that all codes are of the same level of specificity and importance. That’s easy to understand. But if it gets large, organizing and navigating it will be difficult.
- Hierarchical frames capture a taxonomy of how the codes relate to one another. They allow you to apply a different level of granularity during the coding and the analysis of the results.
One interesting application of a hierarchical frame is to support differences in sentiment. If the top-level code describes what the response is about, a mid-level one can specify if it’s positive or negative and a third level can specify the attribute or specific theme.
You can see an example of this type of coding frame below.
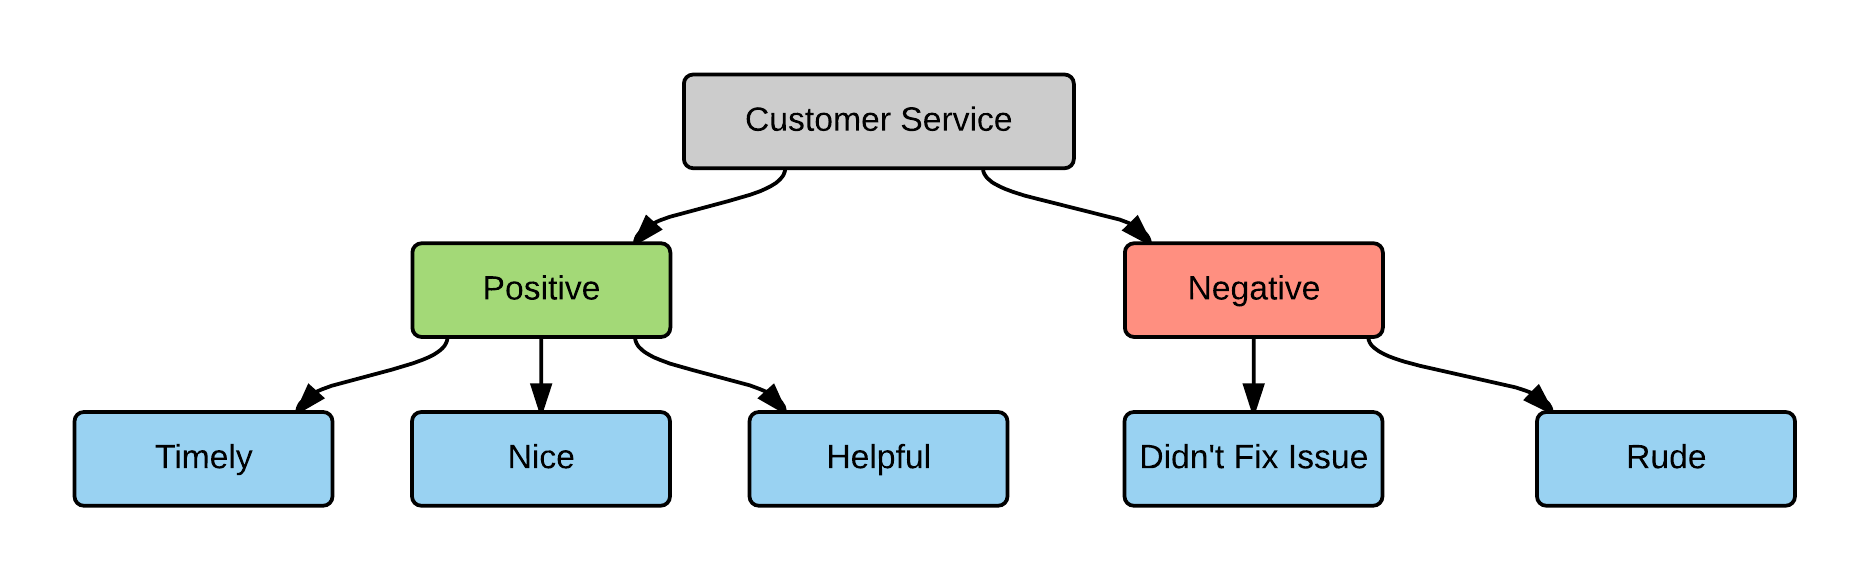
Example of a Coding Frame
Coding frames – pros and cons
Flat code frame
Hierarchical code frame
Supports fewer codes
Supports a larger code frame
(+) Easier and faster to manually code with
(-) Requires navigating the code frame to find the right one
(+) Easy to provide consistent coding
(-) Prone to a subjective opinion of how each answer is coded
(-) Difficult to capture answers that aren’t common leading to a large ‘other’ category
(+) Can organize on basis of organizational structure
(-) Doesn’t differentiate between the importance and levels of specificity of themes
(+) Allows for different levels of granularity
Obtaining simple answers from open-ended questions is crucial for understanding customer sentiments and improving products or services.
Two critical things to consider when coding open-ended questions
A couple of critical things to consider when coding open-ended questions are the size and the coverage of the frame. It is also important to avoid forcing respondents to provide a detailed response; instead, give them the option to skip the question or provide a simple negative response.
Coverage
Make sure to group responses with the same themes, disregarding wording, under the same code. For example, a code such as ‘cleanliness’ could cover responses mentioning words like ‘clean’, ‘tidy’, ‘dirty’, ‘dusty’ and phrases like ‘looked like a dump’, ‘could eat off the floor’. The coder needs a good understanding of each code and its coverage.
While multiple choice questions can streamline the coding process by categorizing responses into predefined options, they may not capture the detailed and nuanced feedback that open-ended questions can. Closed-ended questions provide structured data that complements the qualitative insights from open-ended questions. Open-ended questions allow respondents to express their thoughts and feelings in their own words, uncovering insights that multiple choice questions might miss, such as unexpected pain points and motivations. This contrast highlights the limitations of relying solely on multiple choice questions for gathering comprehensive user feedback.
Having only a few codes and a fixed frame makes the decision easier. If you have many codes, particularly in a flat frame, this makes it harder as there can be ambiguity and sometimes it isn’t clear what exactly a response means. Manual coding also requires the coder to remember or be able to find all of the relevant codes, which is harder with a large coding frame.
Flexibility
Coding frames should be flexible. Obtaining simple answers from open-ended questions is crucial for understanding customer feedback and making informed business decisions. Coding a survey is a costly task, especially if done manually, and so the results should be usable in different contexts. Imagine this: You are trying to answer the question ‘what do people think about customer service’ and create codes capturing key answers. Then you find that the same survey responses also have many comments about your company’s products.
If you need to answer “what do people say about our products?” you may find yourself having to code from scratch! Creating a coding frame that is flexible and has good coverage (see the Inductive Style below) is a good way to ensure value in the future.

Thematic
AI-powered software to transform qualitative data at scale through a thematic and content analysis.
Which coding style is best for analyzing open-ended survey questions?
Let’s look at a couple of different approaches to manual coding open-ended questions, and which one is the best? It is advisable not to force respondents to provide a detailed response and instead give them the option to skip the question or provide a simple negative response. Incorporating open-ended question examples can significantly illustrate the application of deductive and inductive coding styles.
For instance, in engagement surveys, an open-ended question like “What can we do to make your work experience better?” can be coded inductively by identifying common themes in responses.
Similarly, customer feedback surveys might include questions such as “What did you enjoy about our service?” where deductive coding can be applied by categorizing responses according to predefined themes like timeliness, friendliness, and efficiency. This approach allows for a deeper understanding of customer sentiments, emotions, and thoughts across various sectors, including the hospitality industry and product feedback.
Deductive coding using pre-existing frame
With deductive coding, you start with a predefined set of codes. These might come from an existing taxonomy that may cover departments in a business or industry-specific terms. Here, codes are driven by a project objective and are intended to report back on specific questions. Closed-ended questions provide structured data that complements the qualitative insights from open-ended questions.
For example, if the survey is about customer experience and you already know that you’re interested in problems that arise from call wait times, then this would be one of your codes.
The benefit of the deductive approach is that you can guarantee that the items you’re interested in will be covered, but you need to be careful of bias. When you use a pre-existing coding frame, you’re starting with a bias as to what the answers could be.
That’s dangerous territory!
You might miss important themes that would emerge naturally from people’s responses.
Inductive coding using sampling and re-coding
The alternative coding style is inductive, which is often called “grounded.” Here, you start from scratch, and all codes arise directly from the survey responses. Obtaining simple answers from respondents is crucial in this process as it helps in understanding customer feedback effectively. The process for this is iterative:
- You read a sample of the data
- Create codes that will cover the sample
- Reread the sample and apply the codes
- Read a new sample of data applying the codes and noting where codes didn’t match
- Create new codes
- Go back and recode ALL responses again
- Repeat from step 4
If you happen to add a new code, split an existing code into two, or change its description, make sure to review how this change will affect all responses. Otherwise, the same response near the beginning and the end of the survey could end up with different codes!
How to choose high-quality codes
Consider these things when deciding what codes to create:
- Ensure coverage. Codes should cover as many survey responses as relevant. The code should be more generic than the comment itself to allow it to cover other responses. Of course, this needs to be balanced with the usefulness for analysis. For example, ‘Product’ is a very broad code that will have high coverage, but limited value. On the other hand, ‘Product stops working after using it for 3 hours’ is very specific and is unlikely to cover many responses. Avoid forcing respondents to provide a detailed response to open-ended questions; instead, give them the option to skip the question or provide a simple negative response.
- Avoid commonality. Having similar codes is ok. But make sure there is a clear difference between them. In maths, this is referred to as orthogonality and captures how independent two things are. ‘Customer Service’ and ‘Product’ would be orthogonal while ‘Customer service’ and ‘Customer support’ may have subtle differences but are not orthogonal and may work better as the same code.
- Create contrast. Try to create codes that contrast with each other. Capture both the positive and negative elements of the same thing separately. For example, ‘Useful product features’ and ‘Unnecessary product features’ would have contrast.
- Reduce data. Let’s look at the two extremes: There are as many codes as comments, or each code applies to all responses. In both cases, the coding exercise is pointless. So, try to think about how to reduce the number of data points so that analysis useful. For example, ‘Product stops working after using it for 3 hours’ would create an unnecessary data point. Use instead ‘Product stops after use’.
How accurate is the coding for open-ended questions?
Regardless of whether coding is deductive or inductive, it can be tricky to ensure consistency. Obtaining simple answers from respondents can greatly aid in understanding customer feedback and improving products or services.
The reality is that as a coder, your frame of mind and past experiences will color how you interpret things. As a result, different people given the same task are very likely to disagree on what the proper codes should be. Interestingly, one study has shown that the same person coding the same survey on a different day will produce different results.
One way around this is to log all decisions and thoughts that went into the coding. Then, review them when applying existing codes or deciding if a new code is necessary. If you stick to this process, you ensure that the choice of codes can be backed up with evidence.
A different, albeit more expensive, approach to ensure that the code is accurate is to carefully test the reliability of the coding. The ‘test-retest’ method involves the same person coding the data twice without looking at the results. The ‘independent-coder’ method uses a second coder on the same survey. In both cases, the results are then compared for consistency and amended as needed.
6 main takeaways for coding open-ended questions
- Coding is the process of assigning codes to open-ended answers, or other types of text data, after which text can be analyzed just like numerical data. It is advisable not to force respondents to provide a detailed response and instead give them the option to skip the question or provide a simple negative response.
- Code frames can be flat (easier and faster to use) and hierarchical (more powerful).
- Code frames need to have good coverage and flexible to allow for a complete and a varied analysis of open-ended answers.
- Inductive coding (without a pre-defined code frame) is more difficult but less prone to bias.
- When creating codes, make sure they contrast each other and reduce the data.
- Accuracy means consistent coding – which can be achieved by logging and reviewing decisions.


