
As a Product Manager, you want to have an impact and make data-driven decisions as you plan your roadmap and determine priorities. You also want to get a sense of how end-users are adopting your product. To help, we asked some of our Product Managers at Gainsight to answer seven common questions and share examples from their experiences.
1. How can I determine the performance of my product every day—at a glance and in one place?
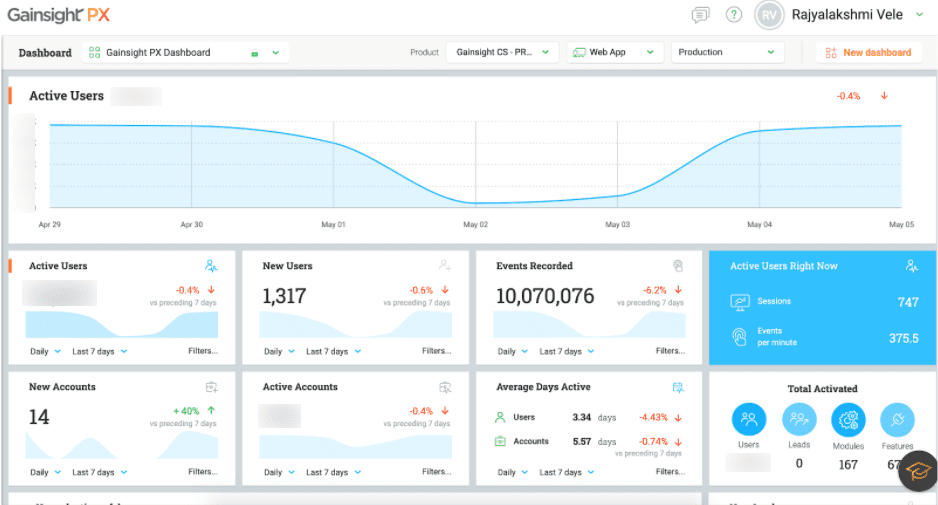
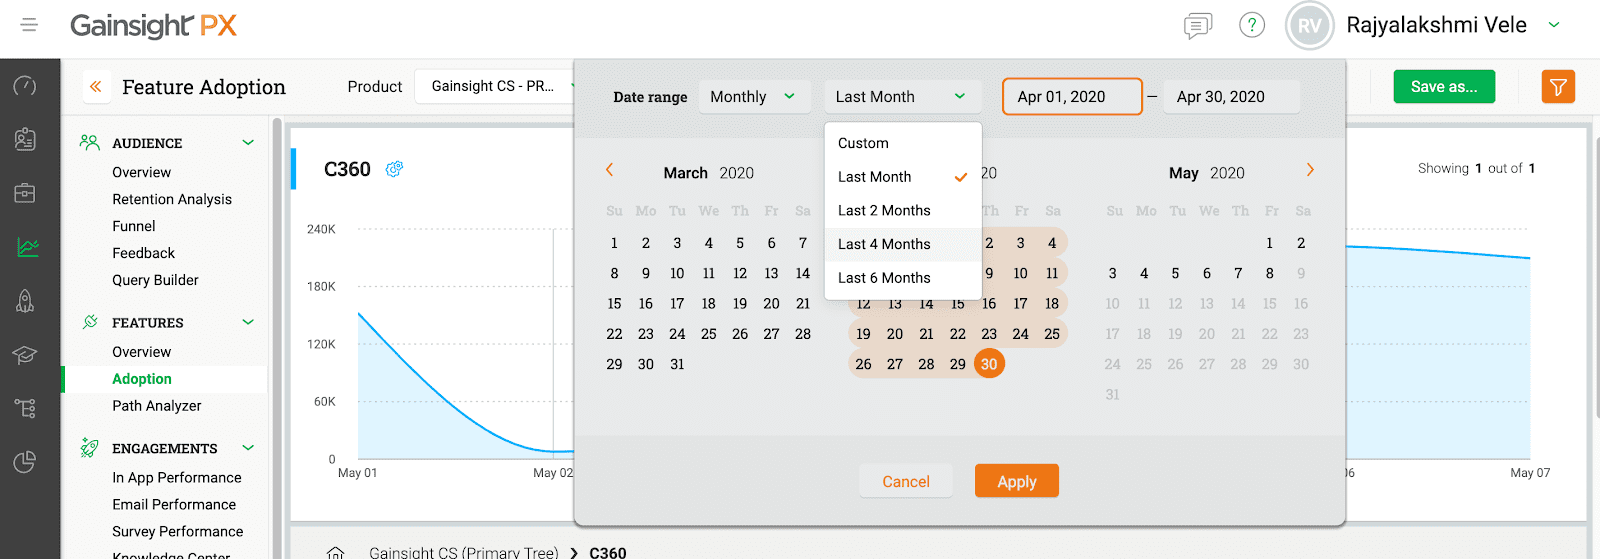
Anyone in a PM or executive role wants to see detailed views of the overall user base such as the accounts that are using the product. You also want different filter options to get an idea of performance for different durations. Product Managers at Gainsight use Gainsight PX to understand these details for our various product lines and more.
2. How does Gainsight make product design decisions?
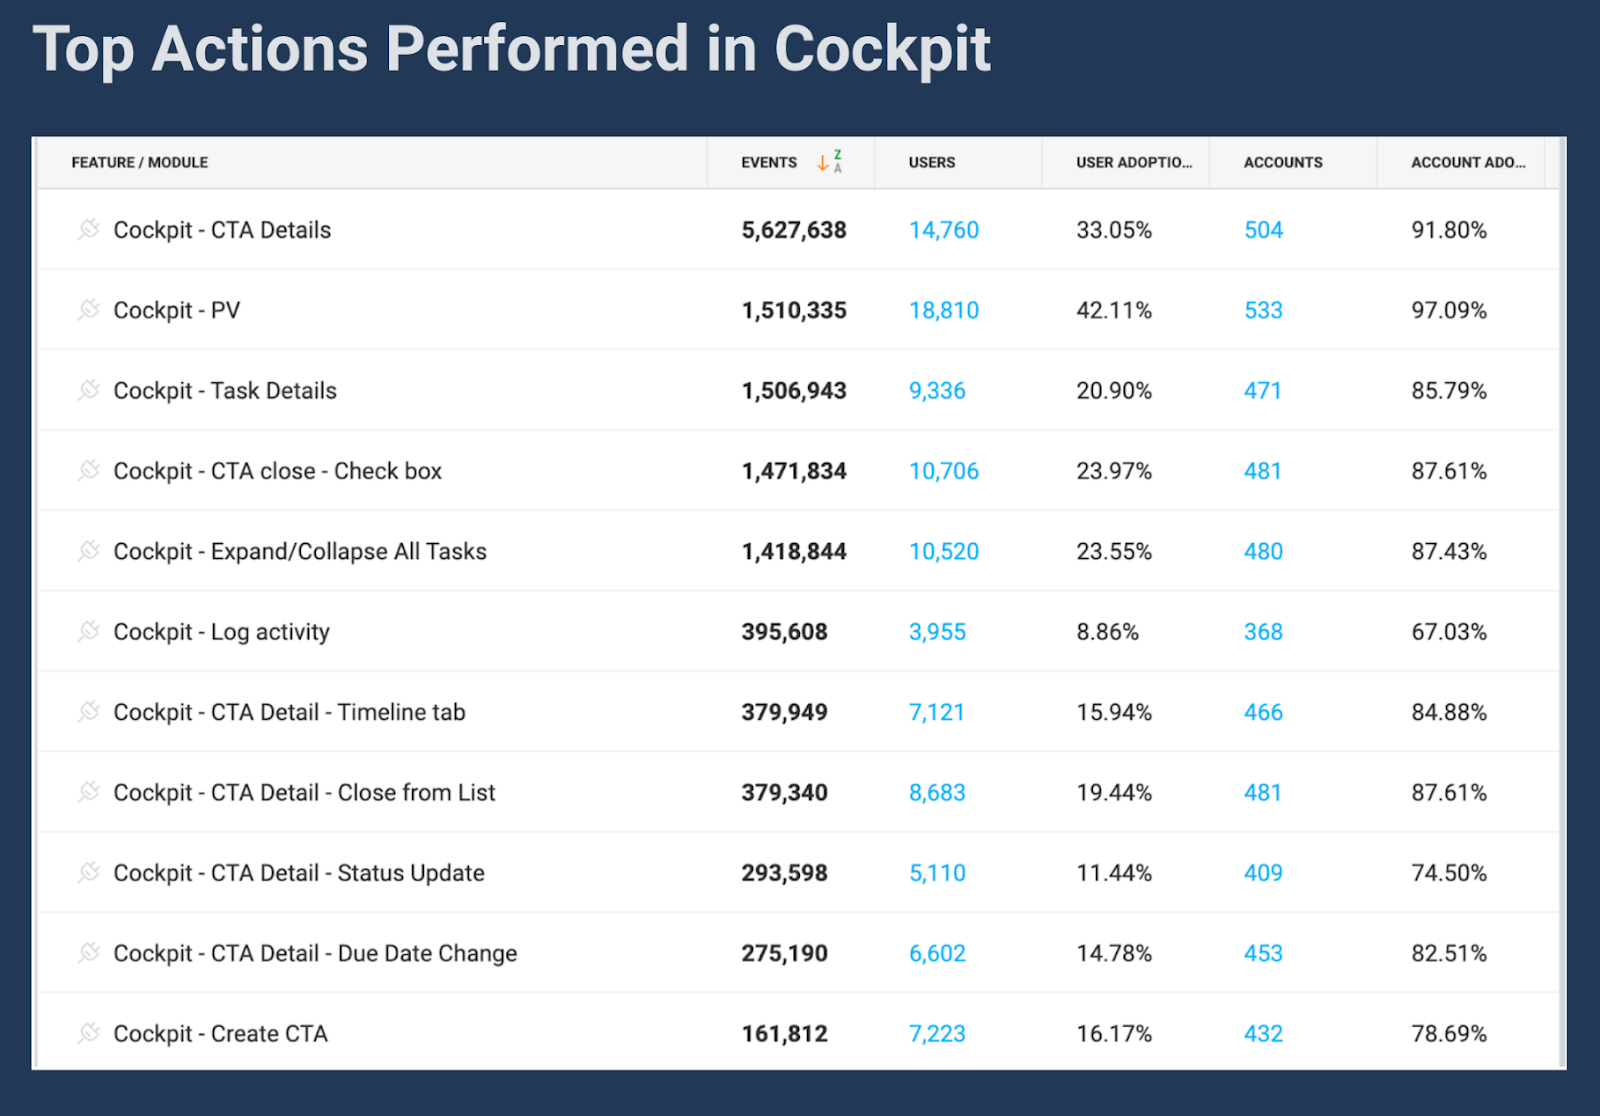
Design decisions actually come from research based on everyday customers’ use and feedback. Gainsight Product Manager, Aditya Marla, worked with his design partner to spearhead several new updates to our platform with the goal of making things simpler yet more powerful. One of the initiatives was a redesign of the Cockpit. It began out of a desire to understand how customers interact with this feature. They started by finding out what top actions users were performing. They also wanted to know what features customers liked the most. They knew Gainsight PX already offered an extensive analysis of usage data. But they wanted deeper insights on what existing features of Cockpit were utilized most and a comparison of which pages were frequently visited. For this, they used the new Path Analyzer, Funnel Creation, and Adoption features in PX.
Funnel
Path Analyzer
 Adoption
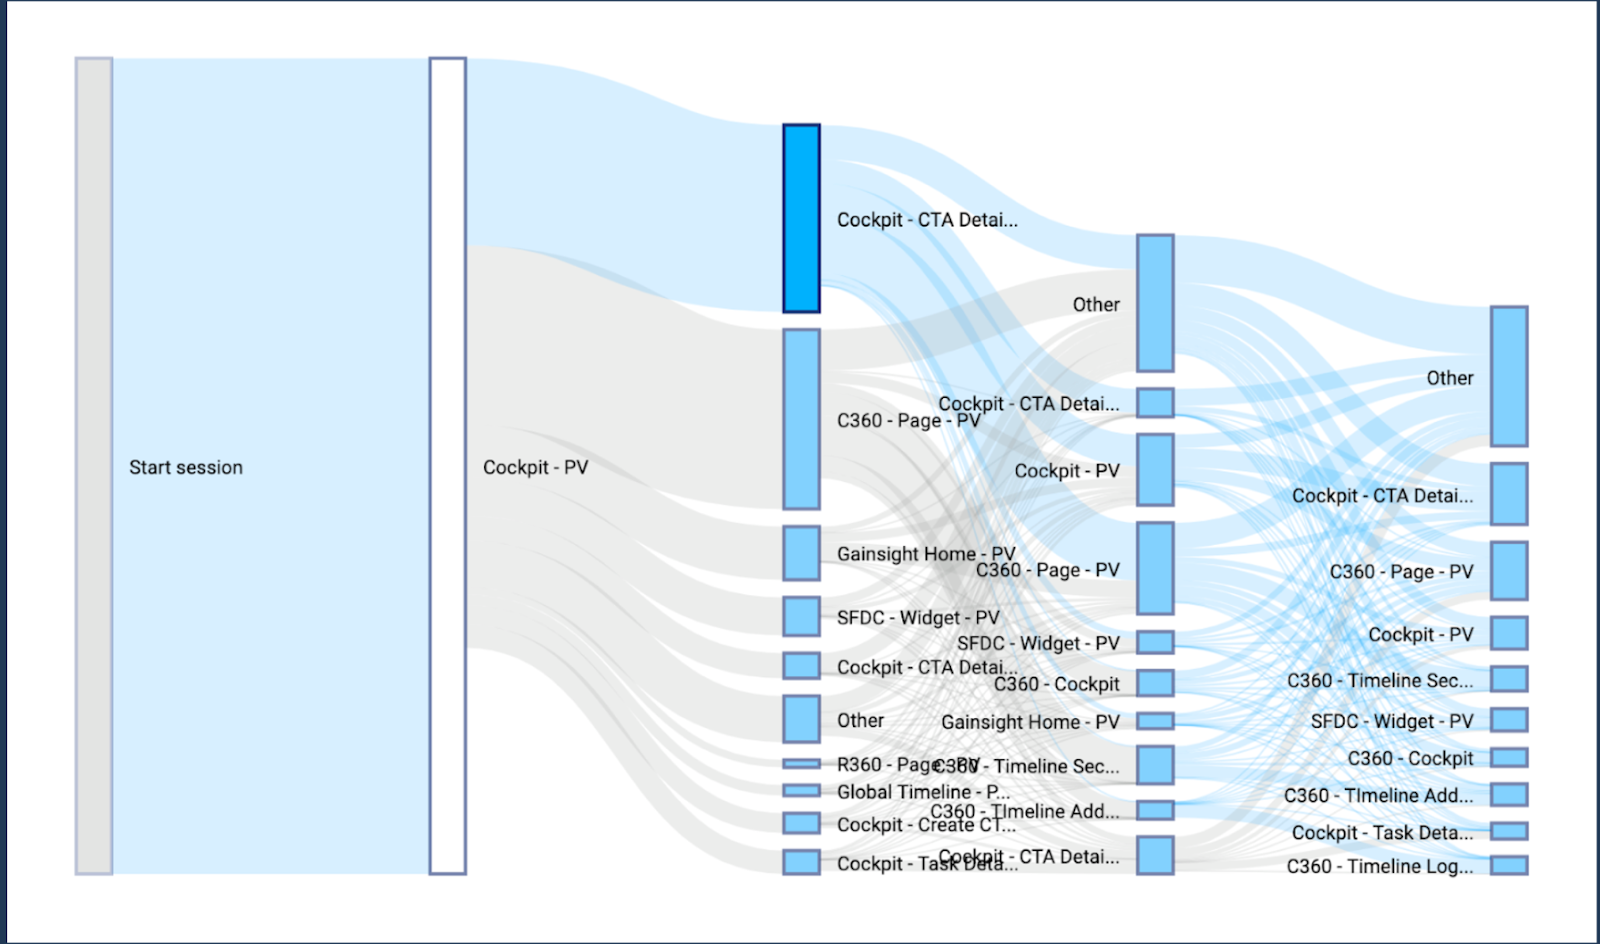
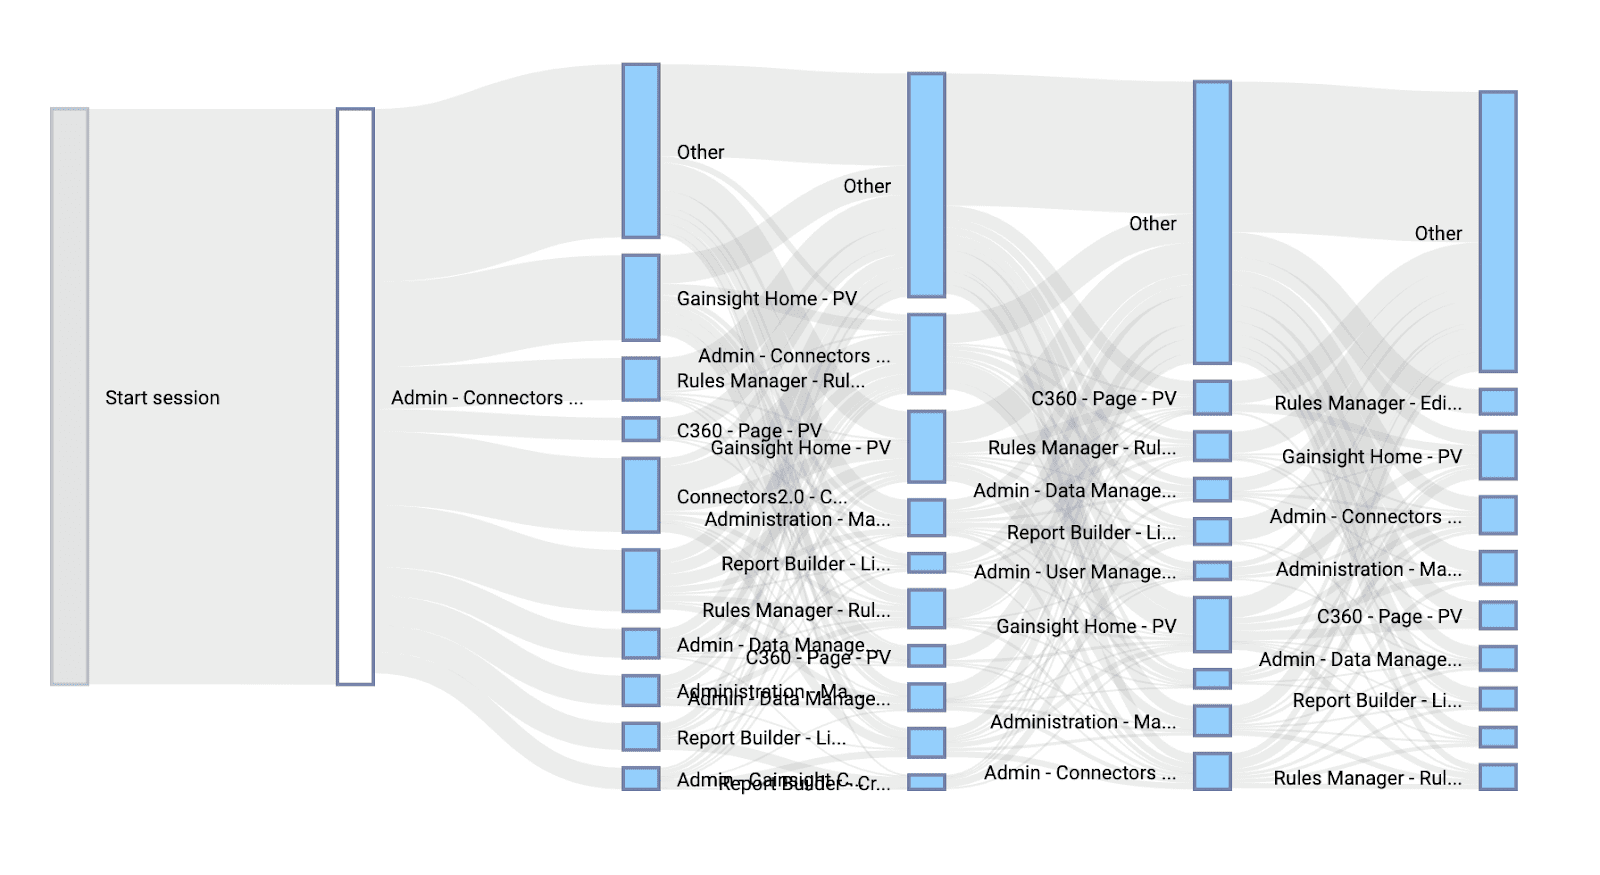
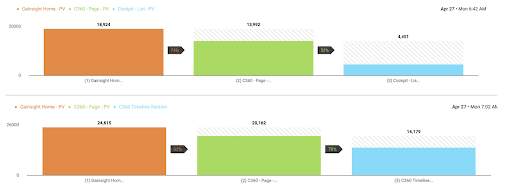
The Path Analyzer feature allowed the product designers to see which customers were taking a particular but recurring path. Users were visiting Cockpit, then the C360 page, and then returning to the Cockpit. The process was taking too much time and effort for the user! Aditya and his partner shared this data point with their customer-users and CS teams to learn more. They discovered this behavior centered on call-to-actions (CTAs) and a need to access key features of a customer-account. When they realized this, the designers decided to build a new feature in Cockpit called Success Card. This feature gave users a direct view of their Customers’ main details from the Cockpit list view and saved time while creating efficiency. No more switching back and forth!
Aditya Marla and his design partner recognized issues within the PX platform and solved for efficiency and productivity by refining and adding new features. The platform also revealed adoption details that gave them an insight into the top actions that the users were performing. Design decisions were made based on where actions should be logically placed. Then, they determined which actions should be made visible to the customer and what actions should be hidden.
3. How do I decide what requirements should be written to improve the customer’s interaction with the product?
The best way to explain this is through the experience of Product Manager Kunal Bhat. Kunal believes that it is always important to balance the ease of use of the product while maintaining its powerful capabilities. It creates an experience that keeps the customer engaged. But decisions must also be driven by data. That is what happened with Kunal and his team. They envisioned ease of workflow for connectors. The team identified that customers had a two-step process between checking the logs and taking appropriate action. After a customer logged in, they went straight to the jobs page. Why? It was very logical that customers wanted to see what jobs were failing if any. But they also needed to look at the logs to see why they were failing. The flow felt restrained.
To improve workflow and experience, the team added a history of performance view on the jobs page that became the feature Path Analyzer. With this information, customers could see the execution history of a particular job and see why it failed. This new feature replaced the two-step process of checking the logs page every time, saving time and effort.
In addition, when product managers interact with a customer, it is sometimes difficult to replicate the steps they may have taken to perform a task. In those scenarios, the Path Analyzer helps product managers better understand all the ‘clicks’ made to complete the task.
 Path Analyzer
Another Product Manager on the Gainsight team, Rakesh Reddy Kondam, and his team decided that they wanted to support the same Path Analyzer feature in different areas of the application. They noted that the capability to import data from S3 was already supported in Rules Engine. Now, they wanted to incorporate it into Data Designer. But Rakesh had an intuition that the customers were not readily adopting the feature. He felt he needed to prove this to the engineering team before they continued to build the same functionality in Data Designer. Rakesh knew that the S3 intake feature in the Rules Engine was already mapped in PX. He examined the adoption data for how many people had clicked on getting the data from S3 and how many were successful in completing the task.
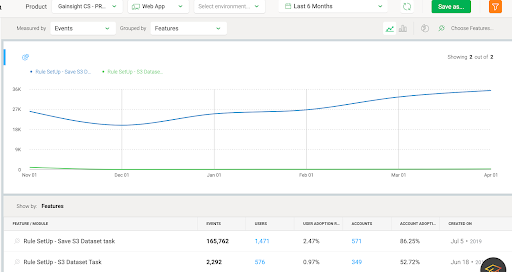
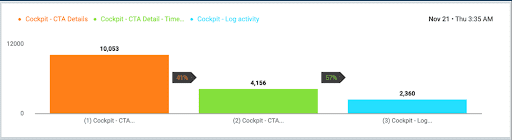
The number of people who had clicked on the “Create S3 task” (165,762) was remarkably higher than those who had succeeded with this task (2,292). The success rate was less than 1%! Rakesh’s theory that the feature was not user-friendly was confirmed. So they decided to take some time and build something better in Data Designer. They focused on simplicity and intuitive design. The solution was a new feature that allows a user to bring the data through S3 with a simple drag and drop of a file.
4. How do I know if my application area is performing better than other applications in the product?
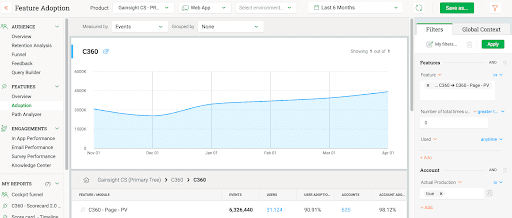
There are many different ways to analyze adoption data in PX. To understand the performance in an application area, however, Product Manager Aditya Marla examined a query feature in PX. He wanted to compare the total number of customers using the product to the total number of customers using a single application area. He engaged the builder feature of PX to pull out these statistics that can be seen below. This graph shows Account level adoption vs. adoption of the feature.
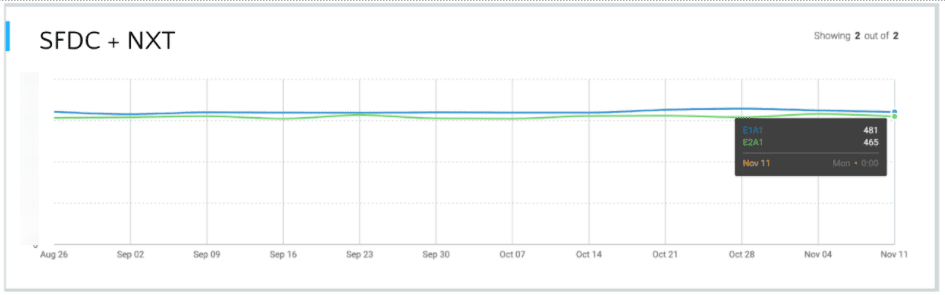
As you can see, there is positive adoption at the account-level, with greater than 90% of accounts on average using Cockpit in a week.
5. How can I know the performance of my application for a particular span of time?
As a Product Manager, Murali Krishna Gopu encountered this very problem. Murali was new to the organization and needed to understand an assigned application. He had to know not only how customers used the application, but also for how long. Despite speaking to the customer-facing teams and engineering teams, Murali desired more information. He searched PX, which quickly revealed the performance of the application for any time of duration of the year!
Below is the graph that Murali pulled using the adoption feature in PX that shows usage of his application for the past six months.
6. How can I see the percentage of users moving from one particular step of a process to the next step?
This question can be easily answered by our Product Manager, Rakesh Reddy Kondam. Rakesh conveyed that the requirement he developed was based on the ideal path for customers. However, the ideal path might not be the one currently used in the product. Rakesh wanted the requirements to be informed by the number of users in each step of the process. He said, “I had used the Funnel feature in PX to find the percentage of the customers at each step, which gave me the number of customers and the corresponding percentage.”
7. What can I do to increase the adoption of my feature?
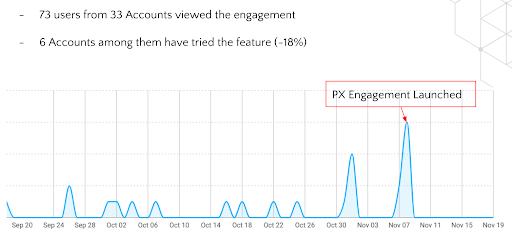
Sometimes adoption is as simple as pointing the customer in the right direction. We had released a feature called Admin defined views in Gainsight. But we saw that customers were still asking for this feature even though it was already released! We realized we needed to guide the users to this feature. So we leveraged PX to launch an in-app engagement. Once the engagement was launched, we had excellent results that are reflected in the graph below. As you can see, there is a spike in the usage of the feature on the day of the engagement launch. It was a great way to leverage PX to increase the adoption of a feature and also capture the adoption results.
In summary, what can I do with PX?
The depth and function of the PX platform is incredible. You will find that PX can:
- Improve the user experience by keeping the workflow simple and straightforward
- Design a product adoption strategy
- Watch the customer’s usage patterns to keep the customer engaged
- Enhance the product roadmap and the customer journey
- Help you make important design decisions
- Provide every customer-facing role a better understanding of the customer journey on the application
As a Product Manager, you will want to take time to explore all of the functions of PX to analyze and understand how it can best serve you.