
A Simplified, Mixed Methods Roadmap: How to Marry Quant + Qual for More Insightful Results
Here are a few easy ways to validate your qualitative data, or dig deeper into the “why” behind your quantitative metrics.
I don’t love spending days looking at statistics.
I have an MA in psychology, and dabbled in quantitative data for most of my undergraduate and graduate years. But once I learned I could be a qualitative researcher, I was thrilled. I jumped, not looking back, into qualitative methodologies.
Along the way, I started to lose my touch for quantitative data. And it was a recent professional goal to get back into a balance between quant and qual.
I’ve realized, it comes down to this:
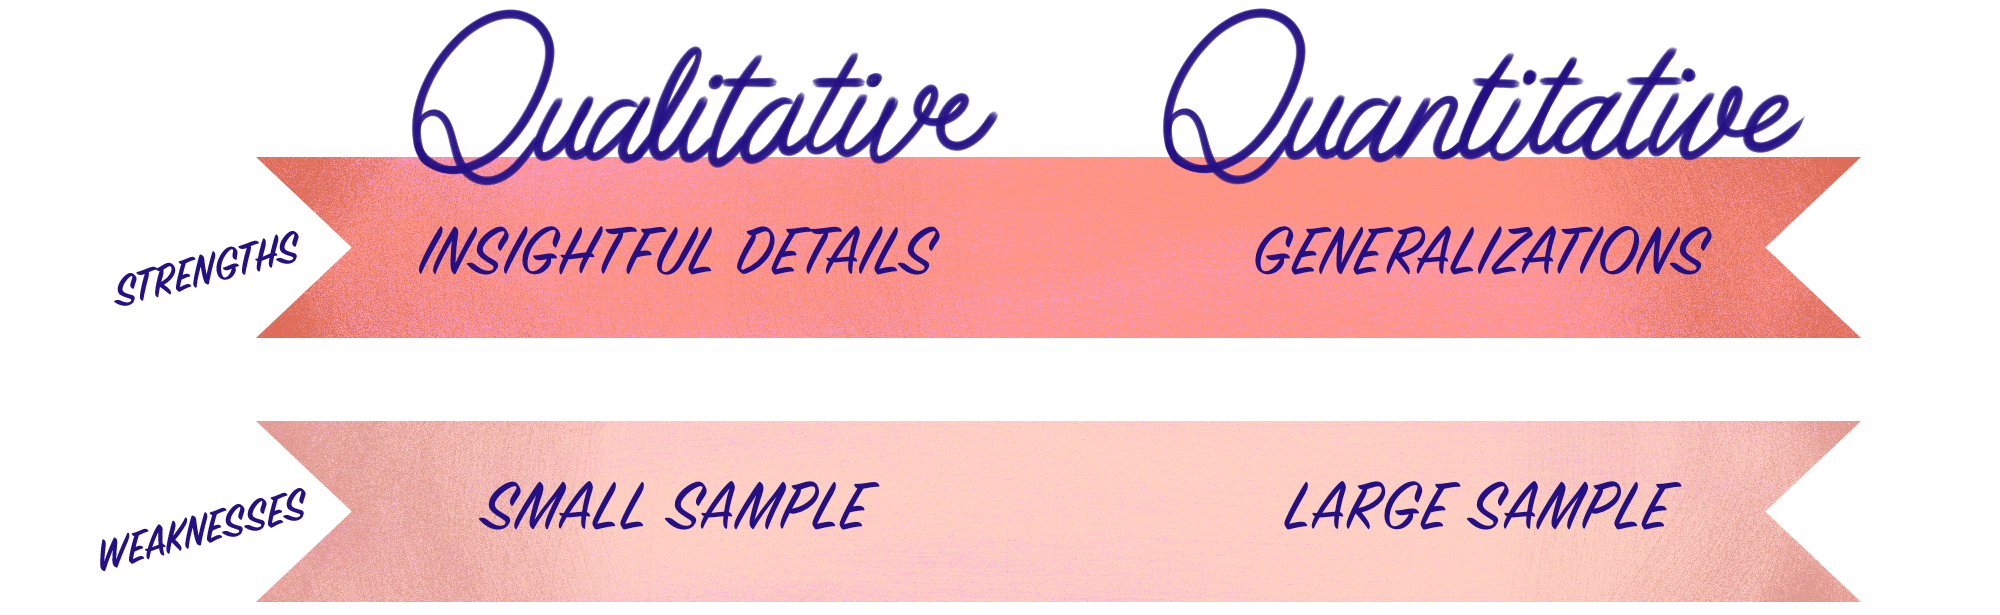
Quantitative = observing and analyzing numbers
Qualitative = observing and analyzing people
Quantitative + qualitative research = true evidence & holistic view
Quantitative data usually tells us what is happening, but qualitative data can then tell us why. In order to truly understand our users, to create great products, and to unlock insights—we need both.
Qual + quant: the ideal marriage
Oftentimes quantitative and qualitative data are thought of as a quarreling couple—pitted against each other and fighting to determine who is “right.”
But they really should be considered a happy marriage. They largely complement each other, and, together, can make insights extremely powerful. Knowing how they can work in harmony is key to making the best, data-driven decisions.
Quantitative data is critical for measuring impact and ROI. It can tell you the magnitude of a specific problem or behavior, reveal how many people are affected, and help you to determine financial impact. Use quantitative data to answer questions like: “how many people are using this feature?” or “how common is this pattern?”
This data, however, needs to be balanced with a deeper understanding. That’s where qualitative data truly shines. It tries to answer: “why are we seeing this behavior from our users?”
What does combining both look like? A mixed methods approach combines quantitative and qualitative techniques to gain a broader perspective on a problem. The most effective mixed methods approaches take advantage of each method’s strengths—and work to mitigate their respective weaknesses.
So where do we start? Types of mixed-methods research
Designing a mixed methods research approach can be difficult. To have the best impact, we should be working back from our research goals—and picking qual and quant methods that are most appropriate. These are the steps I take myself through when trying to choose the best approaches for a project:
- Always look at your objectives, and make sure you keep them top of mind when choosing methods. If you know what you want your results to look like, it’ll give you some direction on what you should be viewing from a qualitative versus quantitative lens.
- Choose methods that have complementary strengths and don’t have any overlapping weaknesses.
- Consider how the data will be collected, and how data will impact other parts of the study. If quantitative data reveals something that is disruptive to the study, are the methods flexible enough to be changed?
- Acknowledge the timeline of the project. This can impact whether certain methods are realistic.
- Understand your own comfort level with qualitative and quantitative approaches, and be okay with asking for help if you feel unfamiliar with a certain situation.
At this point, there are three main ways you can combine qualitative and quantitative data:
- An explanatory sequential design that emphasizes quantitative analysis and data collection first—followed by qualitative data collection. We use the qualitative data to further explain and interpret results from the quantitative data. For example, a survey may be used to collect quantitative data from a larger group. Thereafter, those participants would be selected for interviews where they can explain and offer insights into their survey answers.
- An exploratory sequential design that starts with the qualitative research and then uses insights gained to frame the design and analysis of the subsequent quantitative component.
- A convergent parallel design that occurs when you collect qualitative data and quantitative data simultaneously and independently—and qualitative and quantitative data carry the same weight. They are analyzed separately, and then compared and/or combined to confirm or cross-validate findings.
An Example Case: Research at TeamTicket
Imagine you are a user researcher at TeamTicket, a (fictional) ticket comparison app. You and your team want to better understand how your customers currently are using the ticketing services, in order to make improvements.
Research goal example: How are users currently using our ticketing app, and where are they running into problems?
These aren’t necessarily the only methods to be used—they’re a few different ways to approach these goals. Certain elements of each design can be combined or omitted from projects.
Explanatory sequential design: quantitative-first approach
1. Quantitative: The first thing to do on this team is to understand and determine which metrics are most relevant to observe, and what will determine our success criteria. For this e-commerce-based project, we would review the following usage analytics:
- Conversion rate
- Drop-off rates
- Click-through rates
- Feature usage
This would give us an idea of where users may be struggling (high drop-off rates or low click-through rates), and will also give us a baseline conversion rate for comparison once we make improvements. After looking at the usage metrics, we would send out a large-scale survey, asking participants to tell us which features or experiences are most and least helpful in achieving their goals.
2. Qualitative: After the quantitative collection and analysis, the team would rely on usability testing and interviews to dig deeper into why certain areas are the most/least helpful aspects of the app. In addition, we would follow up with usage analytics. Wherever we see large drop-offs, we’ll ask users about their experience.
Exploratory sequential design: qualitative-first approach
1. Qualitative: We would begin by seeking to deeply understand how users feel about the current product. We could conduct research interviews, observe as they use the project, and have them think aloud during their process. This can highlight pain points, usability issues and frustrations with customers. It gives them the space to really explain what is bothering them, why it’s a pain point, and how they would envision a better product.
2. Quantitative: Similar to above, we would start by defining the key metrics, and success criteria, which would, most likely, be the same in this case. With the qualitative results in mind, after pulling out the patterns, we would send out a survey that asked users to rate the features the qualitative research highlighted as most troublesome, in order to get some larger numbers backing our qualitative data. Additionally, we could send out a usability survey, such as the SUPR-Q, to monitor how usable the app is. Finally, we would send out an overall satisfaction survey, such as a SUS, to continuously monitor as we make improvements.
Convergent parallel design: combined approach
This approach, which gathers qualitative and quantitative data at the same time, would be very similar to both mixed-methods designs above, but, instead of waiting for one or the other, the data would be collected simultaneously.
For this particular problem, the team would send out a survey rating the most/least helpful features while doing qualitative user research sessions. In the end, the results would be analyzed, and compared, to validate findings, or learn where we could dig deeper.
Other ways to infuse quantitative data
If I don’t have time or money to go into a full-blown mixed-method design, I use other metrics to put a quantitative spin on my qualitative research:
- Conduct a benchmarking study. These combine both a quantitative and qualitative approach. In a benchmarking study, you are collecting metrics, such as time on task, task completion rates, and task usability—while also saving time to speak with the user about their overall experience.
- Create a heuristic evaluation. Count and rate the number of times a product violates a set list of usability heuristics (I use Jakob Nielsen’s Ten Usability Heuristics). When you hear users are struggling with a certain area of a product, you can dive in and see how the product compares to these best practices.
- Use A/B Testing. When in doubt, and we are unsure about how a change will affect metrics, such as conversion rate or usage, I always recommend running an A/B test to really measure the impact of the change.
- Always look at Google Analytics. After I spot a trend in my qualitative data, I will go to Google Analytics (or any other analytics platform) in order to see if I can see any usage patterns that validate, or disprove, the insights.
As mentioned, mixed-methods approaches can be tricky, especially when you are considerably more comfortable with quantitative or qualitative methodologies. But remember the goal of the research, ask yourself if it would be better met with a mixed-methods approach, and if so—take the leap.
Nikki Anderson-Stanier is the founder of User Research Academy and a qualitative researcher with 9 years in the field. She loves solving human problems and petting all the dogs.
To get even more UXR nuggets, check out her user research membership, follow her on LinkedIn, or subscribe to her Substack.


Subscribe To People Nerds
A weekly roundup of interviews, pro tips and original research designed for people who are interested in people


