How to find the metrics that matter most for growth and optimization.
The purpose of every business is to get more people to discover that business. And once the business is discovered, to get more of those people to convert into long term customers.Particularly in the product-led world, in which all this happens without direct or very little sales interaction with the customer, it’s important to map the way people get from not knowing your product to paying for your product’s services month after month.
That’s why we need the SaaS customer journey metrics. Because the customer journey metrics allow us to understand every stage and step people take from not knowing your business, to paying for it.
What are the Customer Journey Metrics?
The framework for the customer journey metrics comes from Dave McClure of 500 Startups who, many years ago, introduced what he called the “pirate metrics.”
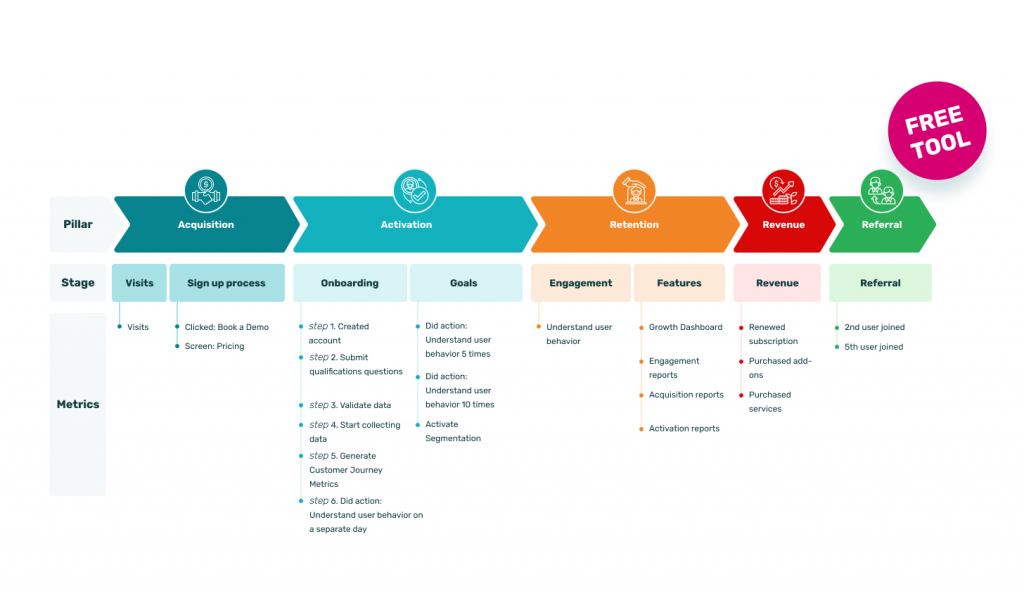
The pirate metrics are acquisition, activation, retention, revenue, and referral. They’re called pirate metrics because the first letters of each of these stages spell out “AARRR.”
McClure’s framework makes a lot of sense, but a lot of companies struggle to define the pirate metrics. Everybody understands that acquisition or activation are very important, but what is the definition of activation for your business? While the concepts are universal, and every business has them, the definition for each of these stages, or “pillars,” are very different from one business to another.
So the customer journey metrics were introduced to fix that; to give businesses a framework for defining each pillar of their growth in a way that will make it very clear to all team members what each pillar means, and what they should be focusing on.
Why do we need the Customer Journey Metrics?
❗First and foremost, you need the customer journey metrics to achieve team alignment; to make sure that everyone on your team understands what they’re fighting for.
So when you say that you need to get more people to discover your business, which falls under the acquisition pillar, your team wants to know:
Which of your business’ metrics show how successful we are at acquiring new users?
The same goes for activation:
What’s the definition of an activated account?
If two different departments use different definitions, customers will suffer because the different departments will optimize for different experiences.
And so on for the next customer lifecycle stages.
❗The second and very important reason for setting up your customer journey metrics, especially in the product-led growth approach, is that the customer journey metrics should become the basis for your product and data analytics.
Again – using different definitions for activation or retention and so on means that different people will analyze the data in different ways, and the same data set will tell different stories.
For one department, it might say: “Hey, your onboarding rate is amazing,” but for another department it might say: “Hey, your onboarding rate is terrible,” simply because they use different definitions. You can imagine, then, that two such departments will always be in conflict, with one believing that the other is trying to undermine them.
So once you have clear definitions for your pirate metrics, you can actually generate a very well established tracking plan that will guarantee that the data you collect from your users behavior will map the customer journey metrics, and will help you get the insights you need.
The biggest problem that a customer journey metrics framework can fix in your data is that it can help you quickly understand at what stage of the customer journey you are losing the most accounts. And it will allow your teams to focus on the data that helps you understand how to fix it.
Let’s take a look at how you can define each stage of your customer journey.
Defining the Customer Journey Metrics map
It all starts with a promise. Your product makes a promise of value to your customers. When that promise is designed to fulfill the needs of a customer, and they recognize this, that’s when they consider signing up.
Well defined promises are crucial for your growth strategy because the promise itself is linked to three metrics of your customer journey metrics.
- When the promise is experienced for the first time – when the value realization happens – we say that the user is onboarded. So the first experience of the promise defines the onboarding stage of the activation pillar.
- When the user fulfills or experiences the promise a second or third time, we say that they’re in the process of forming a habit. And that’s usually an activation goal – you want to see how many of the onboarded accounts have started to make a habit of experiencing the promise of your product.
Activation goals are often linked to the North Star Metric of your business. You want to get people to start making a habit of using your product. - The third stage and metric that’s impacted and defined by the promise of a product is the engagement stage of the retention pillar.
Engagement is defined by answering these questions:
Why are people using your product, and what’s their goal?
What actions help them achieve that goal?
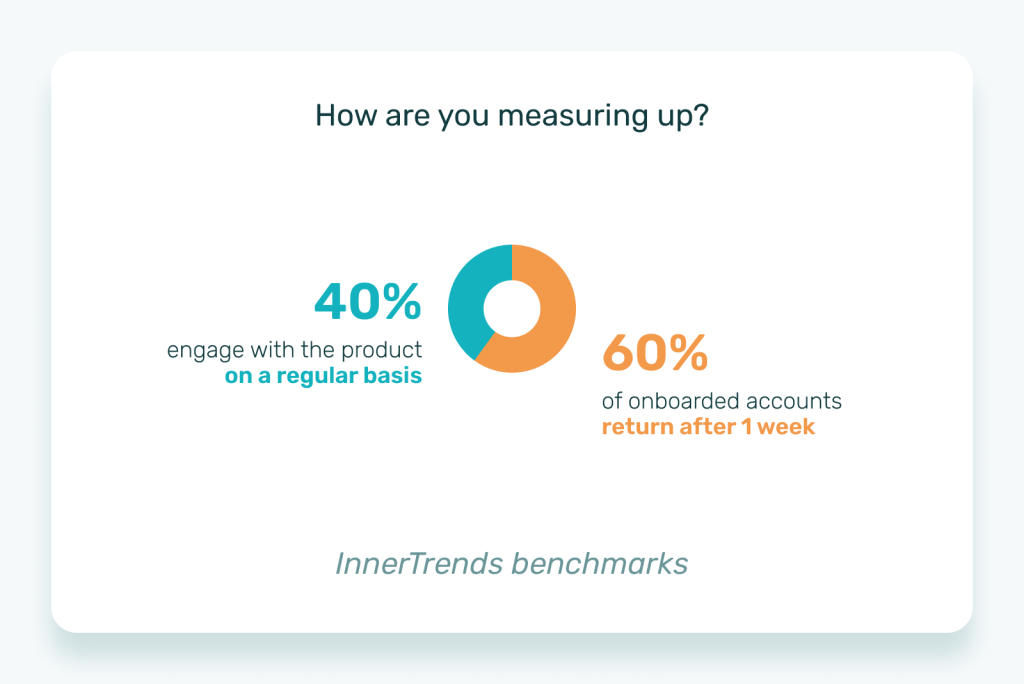
That goal is linked to the promise of your product. So under product engagement, you want to measure the people that experience your promise on a regular basis.
When defining the customer journey metrics, the first thing you want to do is define:
What is the promise of your product?
What is the promise that you make to your users and your customers?
And based on the answer to that question:
What is the core functionality of your product that enables users and customers to experience that promise?
These questions go into your tracking plan. If there are only two metrics that you’re able to track from your users, they’re the following: creating an account, and experiencing the promise. These metrics alone will give you a very good understanding of the health of your business.
But let’s go further and define all of the stages of the customer journey metrics.

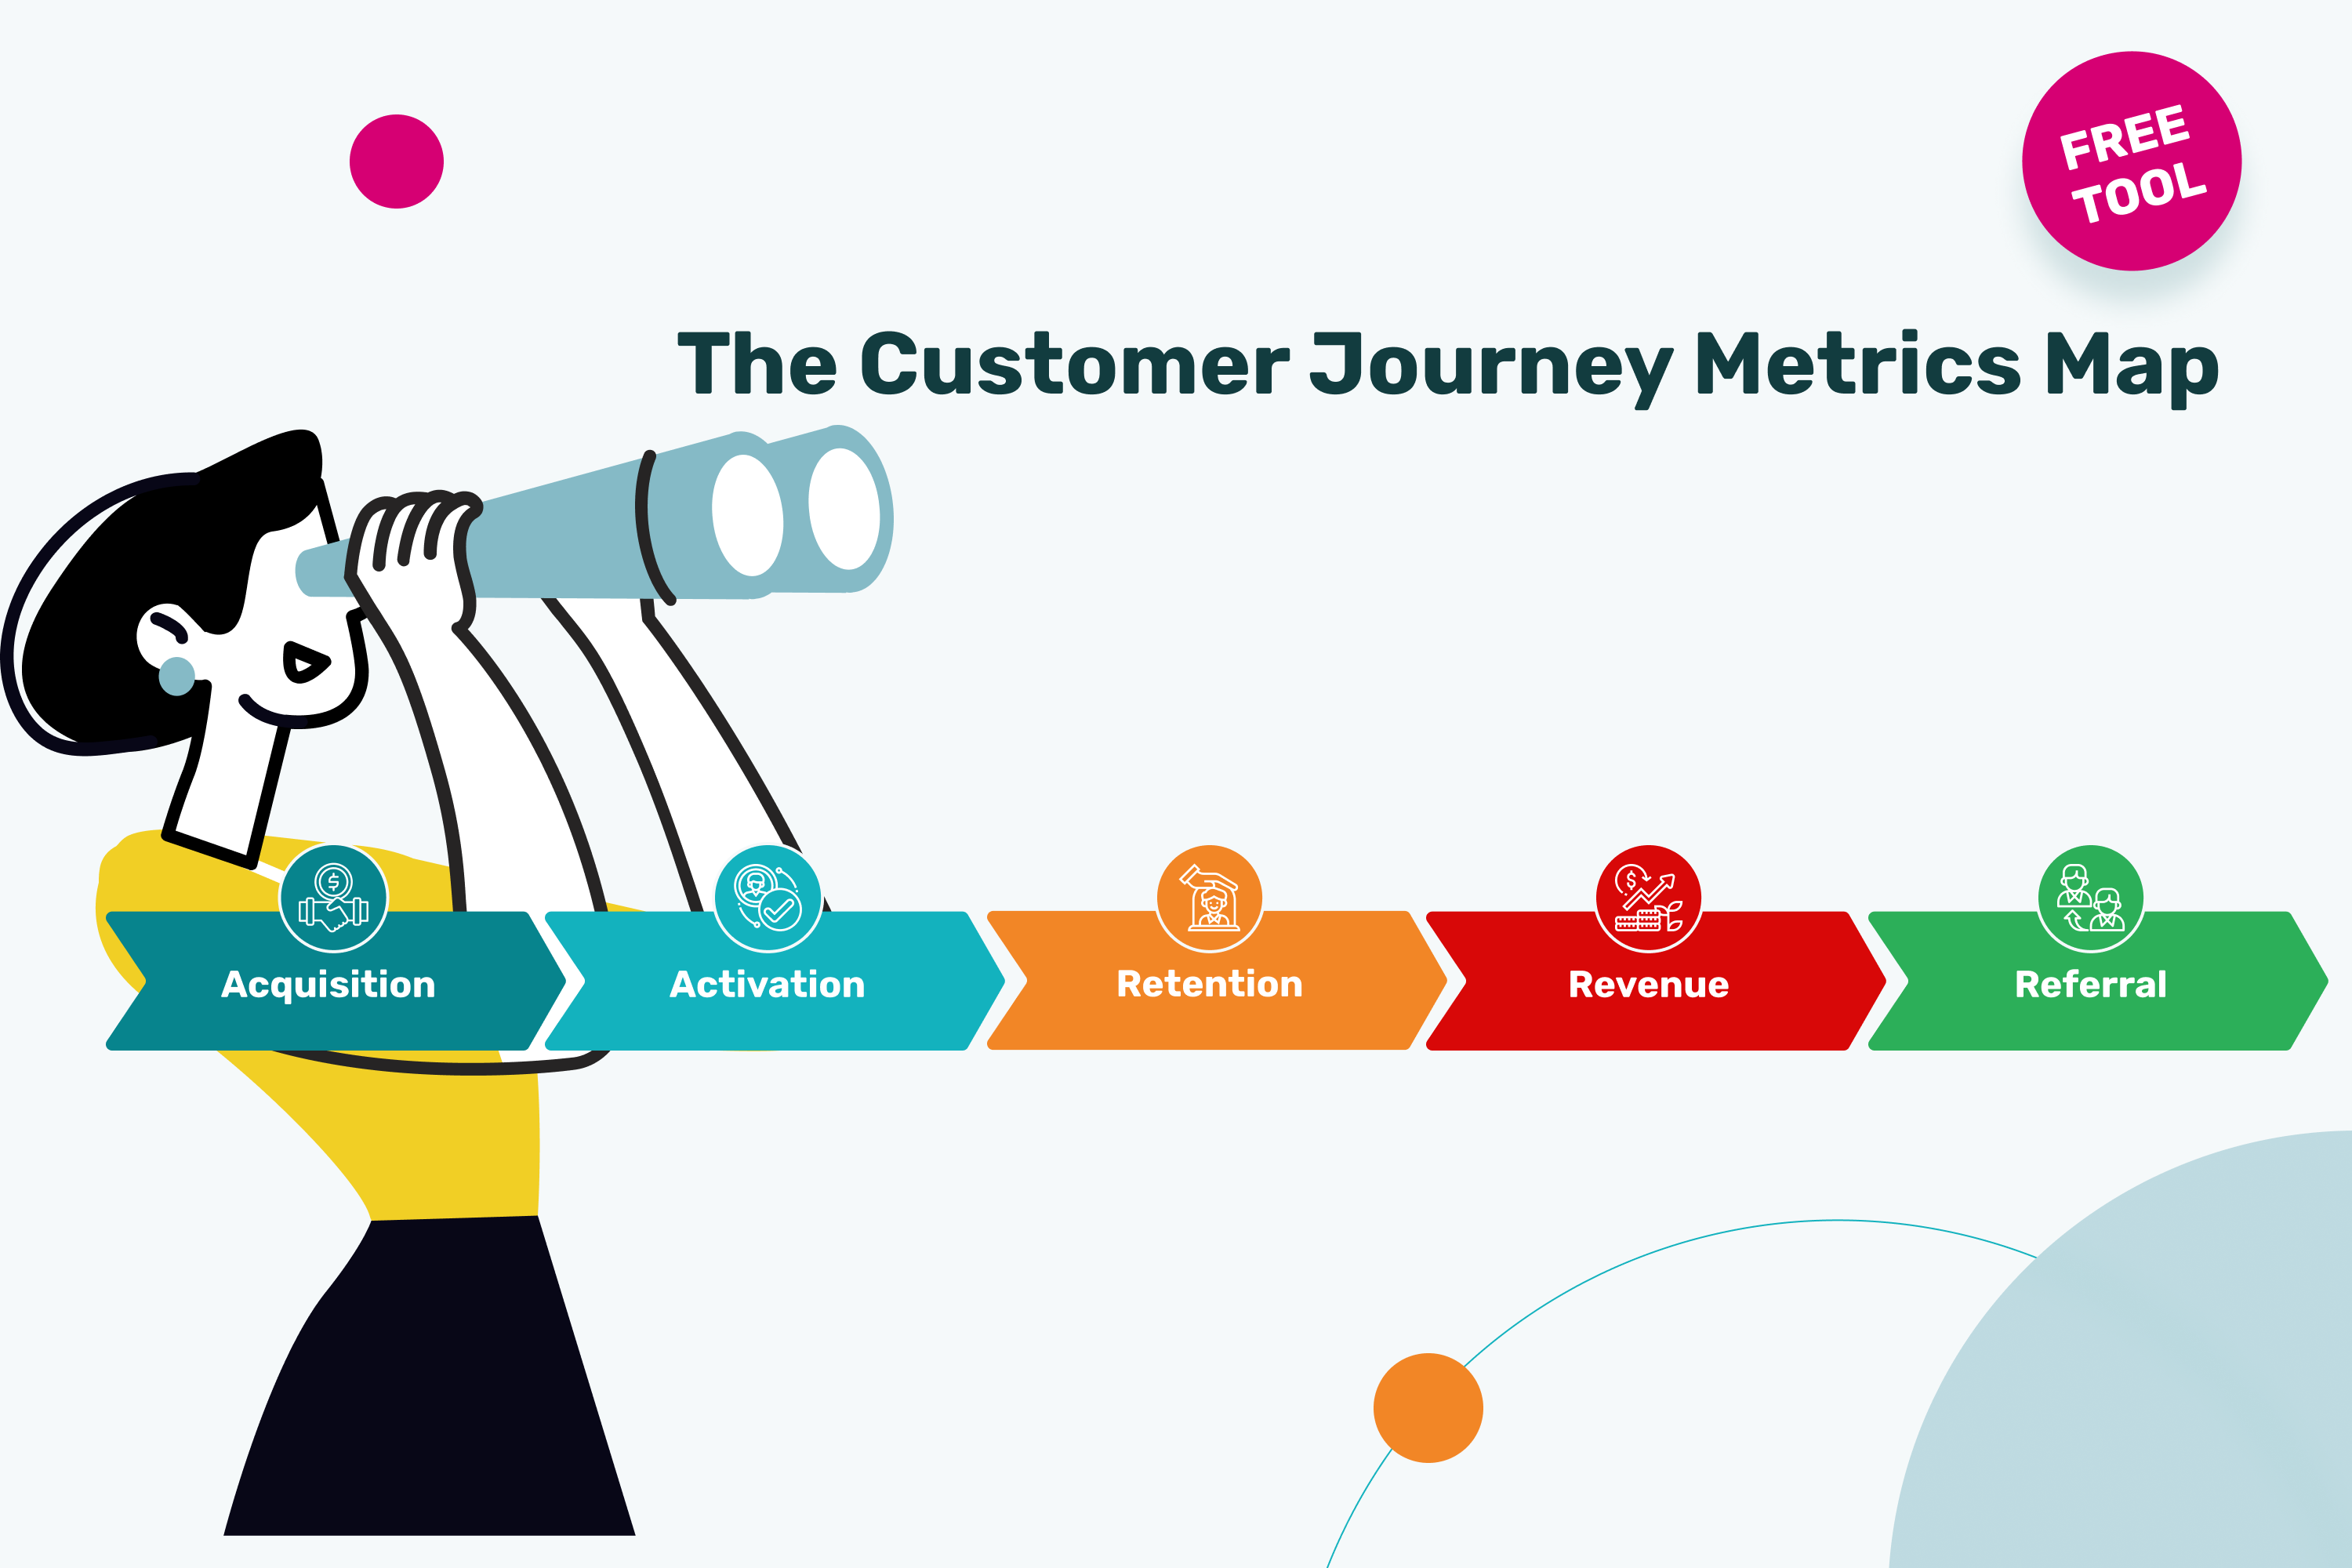
Acquisition. Under acquisition, the purpose of the data is to help you understand how users find you. For acquisition, we typically define two stages: visits, and signup intent.
- Visits (analyzed by traffic source or marketing channel) is the way to measure how people discovered you, or how they know who you are.
- Signup intent is the way to measure that what you are providing is of interest to them.
So under acquisition, you want to find out how many people discovered you, and how many of those people showed interest in your offer. By applying this to all of your marketing channels, you can quickly identify which marketing channels drive more visitors or more people interested in your offer.
For B2B SaaS, we expect 10-20% of the people that discover your website to show signup intent. That typically means that your efforts of targeting are good enough to help you grow further.
Of course, you can try to raise it to much higher levels. We’ve seen companies that achieve 30% or 40% signup intent, but 10-20% covers your base. Having your signup intent under 5% means you should put a lot of focus on improving your acquisition channels or your messaging.

Activation. The question that the activation pillar will answer is: Do users experience your promise?
There are two stages that we monitor for activation: onboarding, and goals.
As mentioned, onboarding is the process that takes people from signing up to experiencing the promise of your product for the first time. You should also cover the onboarding steps to get there; the definition for the onboarding steps that we use is: what are the technical requirements that people need to go through in order to get to your promise?
For example, for an email sending platform:
✏️ The promise = sending email campaigns
✏️ Technical requirements = what users need to do to get to sending campaigns:
- Create campaign
- Implement design
- Add subscribers
️ Watch the video below for more tips on how to make sure you got your onboarding definition right
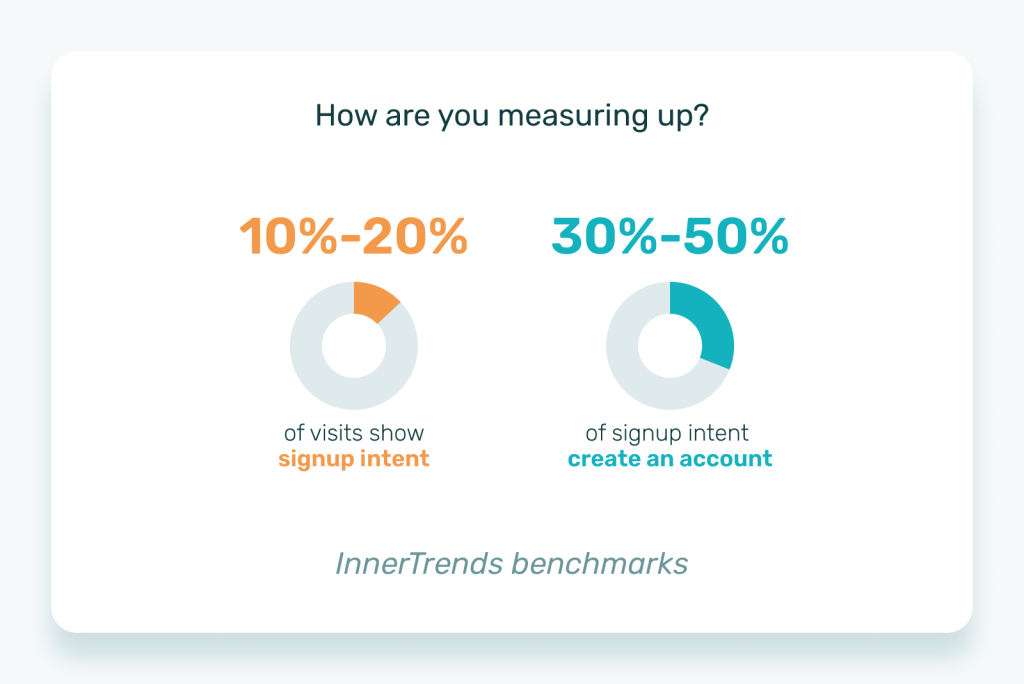
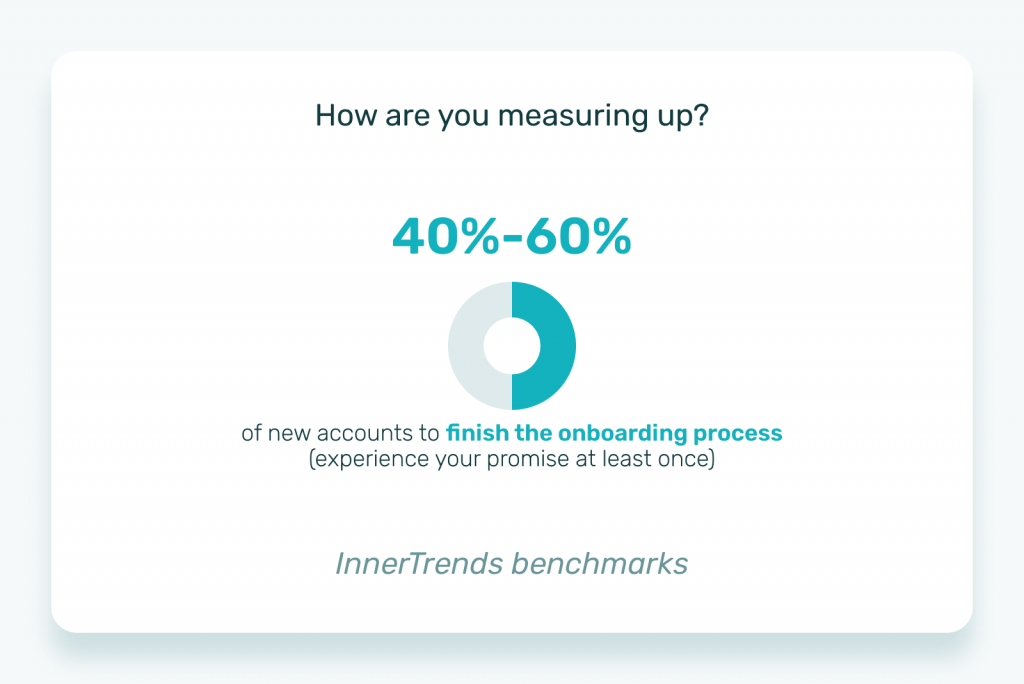
As a benchmark for how many people experience your promise, we typically see that successful B2B SaaS companies have an onboarding rate anywhere between 40-60%.
While we do see exceptions of companies that get it up to 80%, if your onboarding rate is between 40-60%, your growth blocker is most likely elsewhere, and not under onboarding.
A 40-60% onboarding rate gives you, again, a very solid base for growth as you try to scale your company.
In B2C companies, it’s normal to have this onboarding rate be a bit lower, coming in around 30-50%.

Retention. The retention pillar tries to answer the question: Do users come back?
For this, we look at two aspects: engagement, and feature usage.
This is where we want to address the engagement actions that people perform when using your product (again, very much linked to the promise of your business). We also want to list all of the features that your users can interact with within your product, because retention doesn’t just mean coming back to your product and logging in. Retention means that people come back and use your product, and you want to know which parts of your product are more used, and which parts are less used.
As a benchmark for retention, we expect 60% of the B2B onboarded accounts to return and use your product in the first week, and then retention stabilizes around at least 40% week after week.
Now, some companies get what we call “Facebook retention.” Their retention becomes stable at over 90%, week after week.
But a lot of companies see their retention closer to 5-10%. Or after two or three months, their retention falls towards 0%. Those companies have a retention problem, and should focus on fixing it.
It’s important that retention is only calculated for the accounts that are onboarded. By not onboarding or experiencing the promise of your product, a user has no reason to come back and use your product for the long term. So you should expect the retention of people that didn’t finish the onboarding process to get to 0% quickly.
Now, you can imagine that if only 20% of your accounts finished the onboarding process, even if your retention for them is really high, for the 80% that didn’t finish the onboarding process, the retention will quickly go to zero. This is why people experiencing the promise of your product is critical for your business.

Revenue. For the revenue stage, you want to know how your business makes money.
So the important stages from a behavior perspective are:
- How many people upgrade from free to paid, and
- How many of them renew their subscription.
A very important aspect that we look at when we analyze the people that upgrade to paid is how many people upgrade to paid without experiencing the promise of your product. Again, these are the people that are going to churn first, so they’ll only pay for one or two months, and if their percentage is high, you can imagine that they’ll have a huge impact on your lifetime value metric.
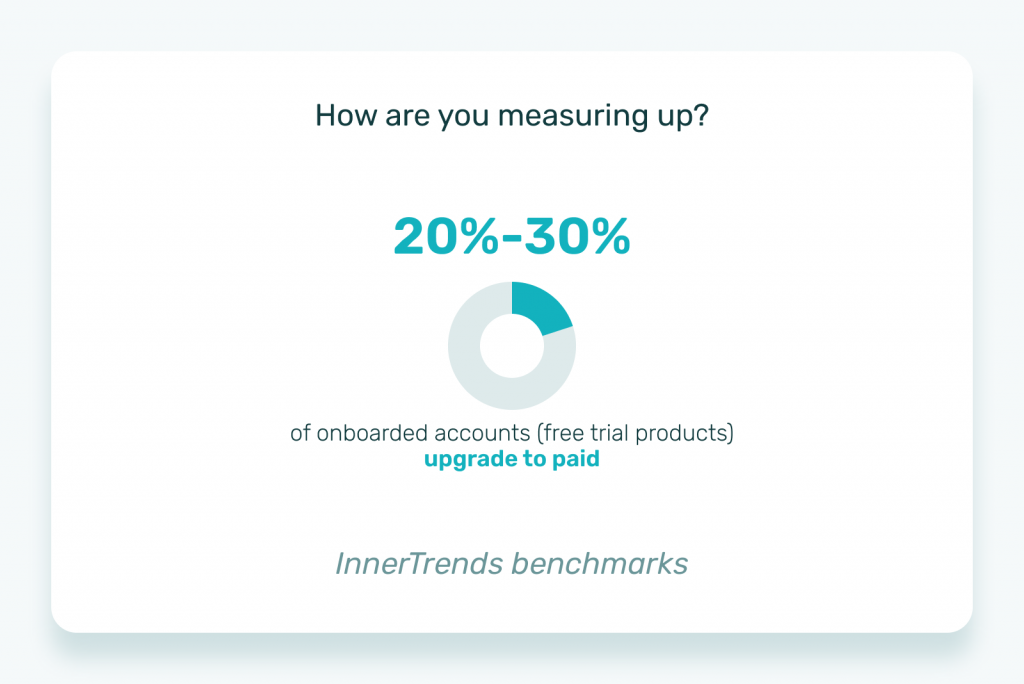
We expect that 20-30% of the people that finish the onboarding process will upgrade to paid on a freemium business model, and depending on other business models, this number should go up to 50%.

Referral. For the referral stage, you want to see if people invite others to use your product.
Few businesses have referral programs, but you should consider referral to include users that invite teammates to use the same account – so not just people from other companies.
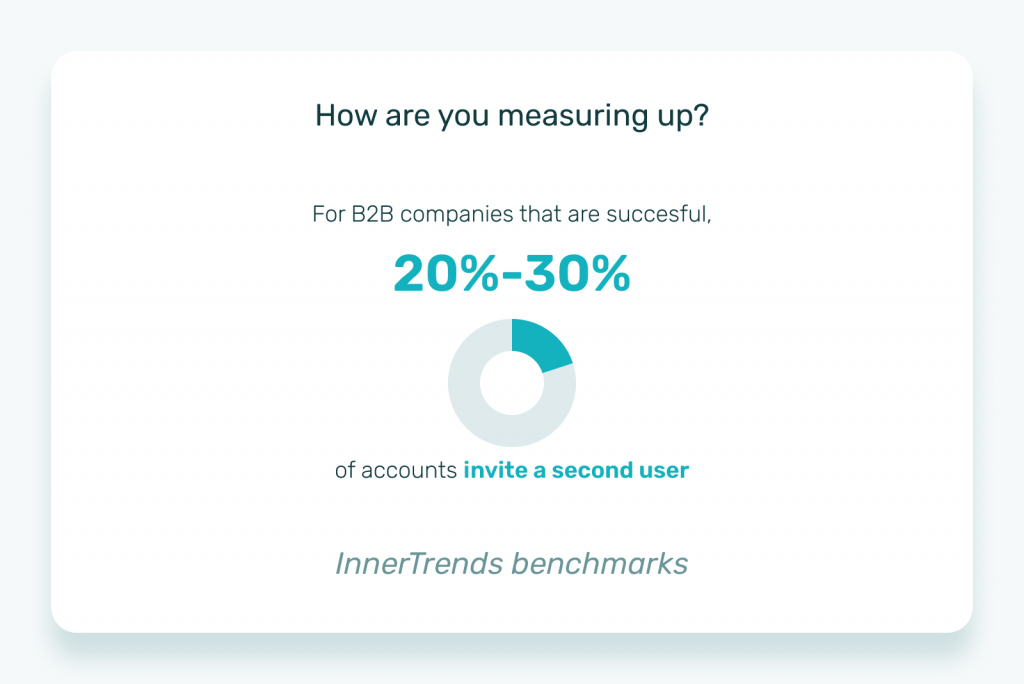
The purpose is to get more people to benefit from your product. The more people a company invites to manage an account, especially in a B2B environment, the higher your chances are that when those people leave the company and move to other companies, they will recommend your product because they know it and have seen its benefits.
So for a B2B company, you want to make sure that you design a product that makes it easy for others to add new users and encourage that – especially if your packages are tiered on number of users.
Challenges of defining the Customer Journey Metrics
The biggest challenge you’ll run into is when you need to find a proxy for defining the action that tells you that you delivered the promise of your product.
That was a mouthful – I know – so let me explain. For some businesses, defining that specific action is very straightforward. For example, for an email marketing service that promises that you’re going to send email newsletters, sending an email newsletter is the action that tells you the promise was experienced.
But for a reporting tool that promises that you will improve your investments, simply delivering an investment report doesn’t mean that the person that read it understood how to improve their investments. So in that case, the delivery of a report does not equal experiencing the promise, because a lot of people that read the report still won’t know how to improve their investments.
In cases like these, you need to find a proxy, or behavior that is more likely to tell you that the person is onboarded and found value in your product.
For a reporting tool, we often recommend that coming back on a different day to visualize a report is more likely to tell us that the person got value from the report. So in that case, the proxy would be coming back on a separate day to view the report. And that would be their definition of the onboarding process.
It’s very important to get aligned with your team on these definitions. So when you have a customer journey metrics map ready, the first thing you should do is gather your entire team around a table, look at the customer journey metrics, and debate if they would want to change anything. The most successful companies we see are the ones that do this.
What makes a company successful is not implementing tracking faster, collecting more data, or implementing more advanced reports. It’s the internal alignment on the metrics that should be followed. And all of the departments look at data in the same way because of that alignment.
Use a framework to get alignment on the metrics that matter
I recommend a tried-and-tested framework to get you through all the stages discussed so far, and help you generate your customer journey metrics map: the InnerTrends Customer Journey Metrics Wizard.
The wizard takes you through a series of questions designed to help you structure your thinking around your users’ journey.
The result: a customer journey metrics map that you and your team can use to guide your next initiatives around product improvement.
Final thoughts
Defining your customer journey metrics is probably the most important thing you can do in order to understand how to improve your growth and achieve team alignment. It comes ahead of the data collection itself and the analysis because it’s the foundation for both of those things.
The customer journey metrics is the starting point for your tracking plan, where you’ll get to define what should be tracked and how it should be tracked, and it’s also going to be the basis for all of your definitions in your product analytics tool for making sure that you have the right reports when analyzing the data.
InnerTrends offers pre-built reports and uses the customer journey metrics to deliver those reports. So when InnerTrends answers a question like: What influences people to go from one onboarding step to another? It can answer that question automatically because it knows the onboarding steps of your customer journey metrics, and knows exactly what data to pull in order to generate that answer.