What is the Happy Index, and what makes it different?
In a world driven by customer-centricity, understanding and measuring customer satisfaction have become paramount for businesses aiming to thrive and grow. But among the myriad of indices available, what sets the Happy Index apart? And how can you choose the right metrics to capture the essence of your customers’ experiences?
What is the Happy Index?
The Happy Index is a powerful tool designed to gauge customer satisfaction in real-time, providing insights into how satisfied your customers are with your products or services, either in general or with a specific aspect of your business.
The Happy Index typically relies on a simple 4-scale Smiley-faced rating system, ranging from dark green ‘very happy’ to red ‘very unhappy’, making it easy for customers to express their feelings intuitively and in seconds.
In certain cases in which a specific user opinion is essential, the 4-point scale is ideal. Examples include recording opinions on services or products that the user has used/experienced. However, while Happy Index with the 4-point scale is the most typical way of measuring customer satisfaction with HappyOrNot surveys, it’s not the only one.
Its simplicity and effectiveness have led to numerous implementations by companies worldwide, with many using it as a benchmark to assess and improve their customer experience. The Happy Index often serves as the default reporting option when businesses seek a quick and reliable measure of customer happiness that can be used to make data-driven, informed decisions to improve operational performance and boost loyalty and revenue.
What is CSAT?
CSAT, or Customer Satisfaction Score, is a common metric in the world of customer service, similar to the Happy Index. It’s designed to gauge customers’ satisfaction with a specific interaction or experience “here and now.”
Typically, CSAT surveys ask customers, “How happy were you with our customer service today?” Respondents then rate their satisfaction on a scale ranging from very dissatisfied to very satisfied, often with a 5-scale set up, though other scales can be used as well.
The results are presented as a percentage of positive answers, providing a clear snapshot of customer satisfaction. CSAT helps businesses pinpoint areas of improvement, track performance, and enhance the overall customer experience.
However, CSAT often has a huge downside due to its typical scale of 5 – people in the neutral and dissatisfied categories don’t fill out surveys. Because of the in-moment simplicity and neutrality by design with the 4-scale Happy Index rating system, businesses collect higher volumes of survey responses and dependable results to base operational decisions.
What is NPS?
NPS, or Net Promoter Score, is a widely used metric that gauges customer loyalty and intention to promote your service, product, or company to others. It’s typically assessed through a simple yet powerful question: “How likely are you to recommend our service/product/company to a friend or colleague?”
Respondents are then asked to rate their likelihood on an 11-point scale, with zero being highly unlikely and ten being extremely likely. NPS offers valuable insights into your customer base’s long-term loyalty and can help you identify areas for improvement, driving growth and customer satisfaction.
An important consideration to understand when using NPS is that it typically focuses on surveying existing customers only. Using retail as an example where typically only 30% of visitors convert to buying customers, businesses will miss capturing data from 70% of their visitor base. Visitors who did not purchase from you provide incredibly valuable insights about exactly why they did not convert so you can learn how to boost sales numbers.
Additionally, as NPS surveys are often sent out after the transaction and are limited to one question, they typically do not reveal the “when” and “where” of the experience making targeted operational improvements challenging. With HappyOrNot official NPS® surveys it is, however, possible to gain visibility to the “when” and “where” as the survey kiosks or digital surveys running HappyOrNot NPS® provide the same end-to-end feedback loop as our other surveys.
What is CES?
CES (Customer Effort Score) is a vital index in the world of customer experience. When interacting with a company, it quantifies customers’ efforts to resolve their issues or accomplish their goals. Think of it as a scale ranging from very easy to difficult.
To gauge CES, businesses often ask customers a simple question such as: “The company made it easy for me to handle my issue.” Respondents then rate their experience on a 7-point scale, with one being “very difficult” and seven being “very easy.” While the 7-point scale is the most common, other rating systems can also yield valuable results. You can measure customer effort on any scale by just asking the right type of question, the data collected will still serve the same purpose.
NPS vs CSAT or Happy Index
NPS primarily focuses on measuring loyalty and future intent. It asks the classic question, “How likely are you to recommend our service/product/company?” using an 11-point scale. NPS provides insights into long-term loyalty trends, helping businesses gauge their customer base’s overall satisfaction and loyalty over time.
On the other hand, CSAT and Happy Index aim to present customer satisfaction in the here and now, typically with answers to questions like, “How happy were you with our customer service today?” Customer satisfaction surveys can adapt to different scales. The results help pinpoint immediate satisfaction levels, drive operational improvements and prove the effect of actions taken.
Survey rating scales: even, odd, or other?
When gathering feedback through surveys, one crucial decision can significantly impact the quality of the data you receive: the choice of rating scales.
Even or odd, colored or with emojis, each option offers advantages, and the decision ultimately comes down to your primary goal. Let’s explore the differences between these rating scales.
Even scales
Even scales, such as 2, 4, or 6-point rating systems, offer simplicity and clarity in survey responses. They streamline the decision-making process for respondents, making it easier for them to provide quick feedback.
Because there is no middle option, respondents must take a clear stance of on either side, either satisfied or dissatisfied. This can help reduce the neutrality bias often seen in surveys that provide a middle-ground option.
Odd scales
Odd scales, such as 3, 5, or 7-point rating systems, introduce a level of precision that can be optimal for identifying areas of your service that with small improvements could easily shift passives into promoters.
Colored or emoji scales
Sometimes, regardless of the number of scales, to ensure a survey scale is intuitive and easy to answer, adding colors or emojis to the scale is beneficial especially if your goal is to collect high-volume in-moment feedback.
A colored scale system most typically used and familiar internationally is traffic lights, red for unsatisfied, yellow for neutral, and green for satisfied. Emoji scales most used are the universally familiar symbols of thumbs up (positives) or thumbs down (negatives) or ‘smiley faces’ where smiles represent happy and frowns represent unhappy.
In many instances, the number of scales are combined with colors or emojis to even further enhance simplicity and engagement.
Which scale should you use?
With various indices such as the Happy Index, CSAT, NPS, and CES available, thoroughly evaluating your objectives and audience preferences is important.
Let’s take a look at some questions you should ask before choosing a scale.
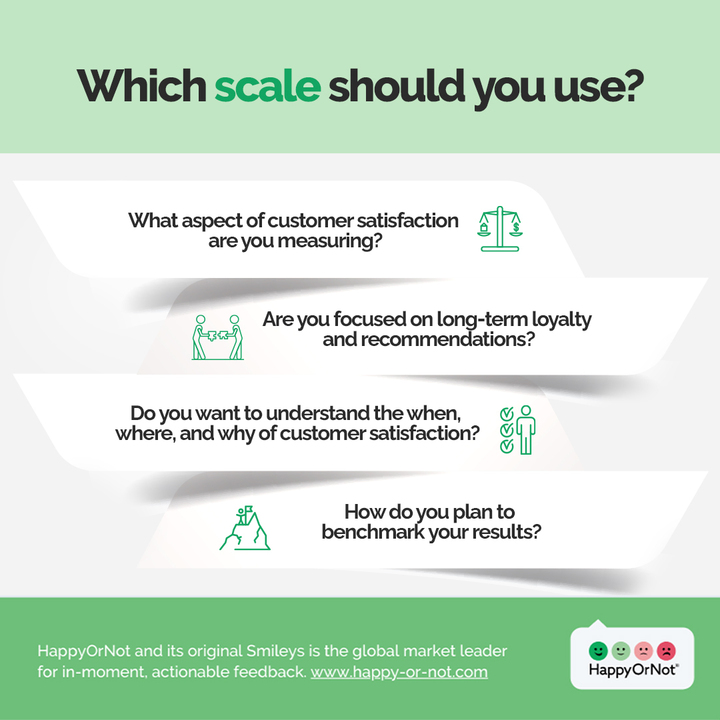
What aspect of customer satisfaction are you measuring?
Begin by clarifying the specific aspect of customer satisfaction you intend to measure. Are you interested in obtaining a broad assessment of overall satisfaction, or do you need to pinpoint satisfaction regarding a particular interaction or issue “here and now”?
The Happy Index, for instance, is designed to gauge satisfaction, either generally or on specific business or operational area. It typically utilizes a 4-scale metric and often aligns with questions resembling those commonly found in CSAT surveys. By understanding your measurement goals, you can better match them to the most suitable index.
Are you focused on long-term loyalty and recommendations?
Consider whether your primary objective is to measure the long-term loyalty of your customers and their likelihood to recommend your product, service, or company to others. This is where NPS often comes to the picture. However, due to its nature, NPS is typically unable to measure the satisfaction of non-buyers, leaving most feedback out.
It employs the standard 11-point NPS scale, providing valuable insights into customers’ willingness to advocate for your brand. If cultivating long-term customer relationships and promoting recommendations are central to your strategy, NPS could be the right choice for your surveys.
Do you want to understand the when, where, and why of customer satisfaction?
A weakness of the traditional NPS is that it doesn’t take into account when, where, why and to whom consumers actively recommended or discouraged a brand. It also doesn’t capture a consumer’s emotion at the time and place they experienced.
All HappyOrNot surveys provide a tool to gather instant feedback at the moment of the experience, connecting the feedback to the time and place and reason for feedback. They are also excellent for gathering feedback from passers-by and visitors who have not converted to buyers, thus offering important insights to the overall experience with your brand, service, and products.
How do you plan to benchmark your results?
Reflect on your benchmarking needs. Are you looking to compare your survey results against industry standards or previous data? The Happy Index benefits from numerous HappyOrNot implementations with 1.5 billion customer voices collected and analyzed, including industry benchmarking features, makes it a convenient choice for those seeking industry-specific insights.
With its percentage-based reporting, CSAT also allows benchmarking against historical data or industry averages. NPS and CES can also be benchmarked, but they may require a more customized approach, depending on your specific requirements and data availability.
Conclusion
Each of the described indices offers a different perspective on customer satisfaction and loyalty. The choice of the index should depend on your organization’s goals and the specific insights you seek to gather. In today’s competitive business landscape, the key is to listen to your customers, act on their feedback actively, and continually strive to enhance their experience to ensure their satisfaction and loyalty.
Frequently asked questions
What are some key considerations when selecting the correct survey scale?
Consider the aspect of customer satisfaction you intend to measure, whether it’s long-term loyalty, immediate satisfaction, or the ease of resolving issues. Additionally, think about benchmarking needs and audience preferences.
Can the Happy Index or other satisfaction indices help identify trends or patterns in customer behavior over time?
Satisfaction indices like the Happy Index can help identify trends and patterns in customer behavior over time. By consistently collecting and analyzing data over extended periods, businesses can gain valuable insights into how customer satisfaction evolves, which aspects of their products or services require improvement, and whether customer preferences change.
Are there cultural or regional differences in interpreting satisfaction indices like NPS?
Yes, cultural and regional differences can impact the interpretation of satisfaction indices like NPS. Cultural norms, communication styles, feedback delivery, expectations, and word-of-mouth behavior can vary, affecting how respondents rate satisfaction. To address these differences, businesses may need to adapt their survey approaches and consider localized strategies.
Are there any industry-specific variations in how satisfaction indices are used and understood?
Yes, industry-specific variations exist in how satisfaction indices are used and understood. Each sector, from hospitality to technology, emphasizes different aspects of the customer experience. For example, healthcare values patient experience, while technology assesses product usability.
Can HappyOrNot provide specific survey rating scales like NPS?
Yes. HappyOrNot can cover all typical survey types: NPS, CSAT, and CES. While Happy Index provides the best solution for most businesses, it is up to the customer to choose the most suitable scale and index for their purposes.