Data Snapshot: Media Use Benchmark, 2016
March 15, 2016 Leave a comment
 We just published a Temkin Group data snapshot, Media Use Benchmark, 2016. This is our annual analysis of how much time consumers spend using different media channels (see last year’s data snapshot).
Here’s the data snapshot description:
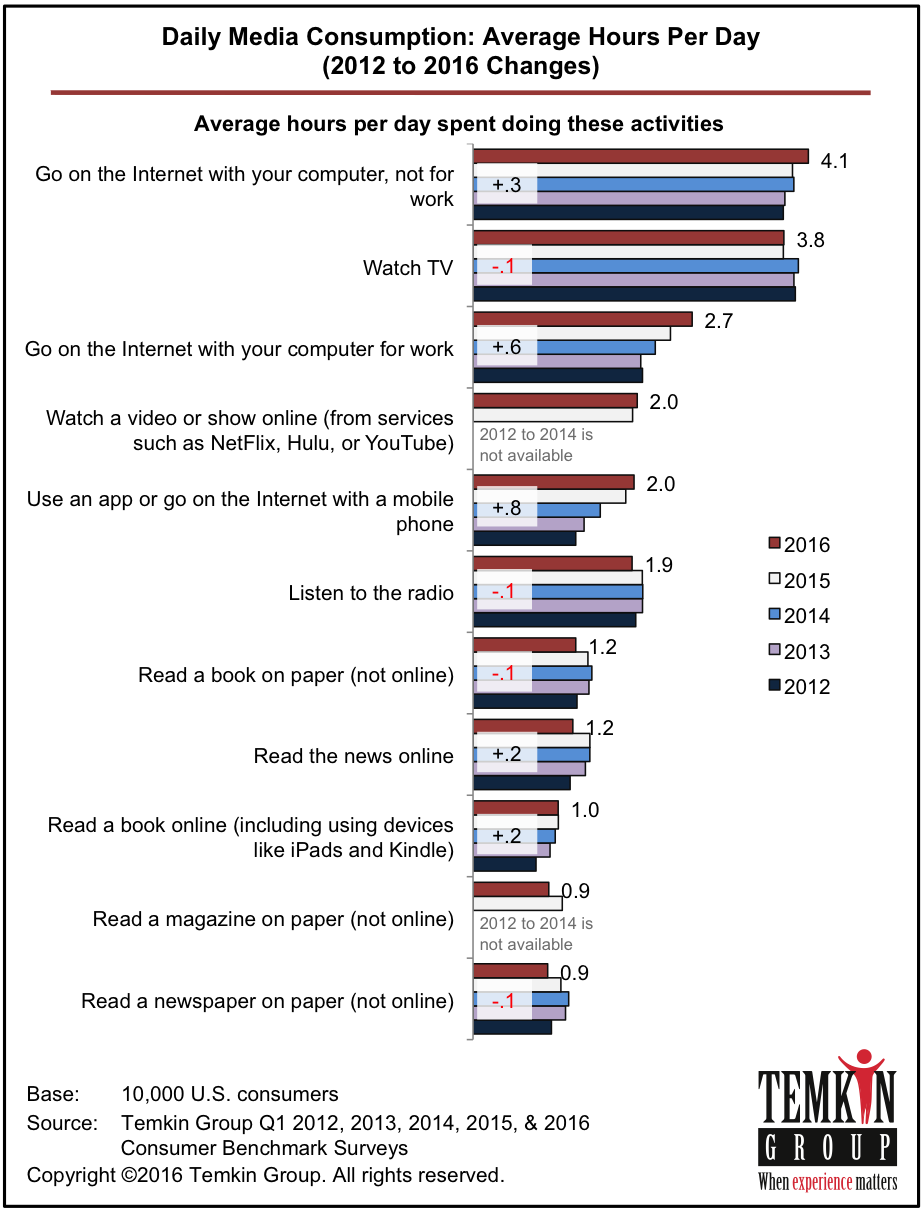
In January 2016, we surveyed 10,000 U.S. consumers about their media usage patterns and compared the results to similar data we collected in January 2015, January 2014, January 2013, and January 2012. Our analysis examines the amount of time consumers spend every day watching television, browsing the Internet (for both work and leisure), reading books (both print and electronic), reading newspapers (both print and electronic), listening to the radio, reading a print magazine, and using a mobile phone. This data snapshot breaks down the results by income level, education level, and, most expansively, by age.
Here’s a portion of the first figure from the data snapshot that contains 12 data-rich charts. As you can see, over the past five years:
- Time spent with mobile web/apps has increased the most, followed by using the Internet at work and at home.
- Time spent with TV, radios, books, and newspapers have declined.