


Contents
When there is a big decision to be taken, for example, buying a new phone or looking for rentals, who do you ask first?
– Your family and friends.
This is because you trust and value your friends and family above others. And believe it or not more than 70% of customers trust their friends and family when it comes to product recommendations.
This is why businesses need to pay attention to their NPS score. This score tells you how likely your customers are to recommend you to their friends and acquaintances.
While the numerical score provides valuable insights, it often lacks the depth needed to understand the underlying reasons behind customer sentiment.
This is where NPS Text Analytics comes into play. NPS Text Analytics involves analyzing the open-ended feedback that customers provide alongside their NPS ratings. By leveraging natural language processing and machine learning techniques, businesses can extract meaningful insights from customer comments.
And by extracting these meaningful insights you ultimately take action to improve your NPS score, boost your customer retention, and drive positive business outcomes.
But how to achieve this? Let’s find out.
Challenge with NPS
More than asking the right NPS scale question, the first step to improving the NPS score is to analyze the data the right way.
But what I’ve noticed with many businesses is that they don’t know how to!
The stumbling block? They get overwhelmed by the number of responses because they do not have any efficient NPS tool to process such a huge number of data.

So what to do?
The Fix -Text Analytics Software
Here’s what I do –
Let’s say I receive about 350 comments every week which equals about 1500-2000 comments in one month. That’s a lot, right? So, what I do is, use SurveySensum’s Text Analytics Software to efficiently manage and analyze the NPS program.
All I had to do was:
- Train the system for like 100 responses and divide them into categories. It could be ‘support’, ‘technical glitch’, ‘pricing’, and more.
- After that, the Text analysis will automatically categorize every comment automatically.
- And gives me a detailed NPS report of top trends and sentiments in just a few minutes
Piece of cake!
Let’s talk about it with the help of text analytics for NPS case study of a media giant that I recently helped boost the NPS score.
Case Study: Media Company’s NPS Journey
The Challenge
A prominent media company was on a mission to boost its NPS and close the feedback loop in real-time.
So, what did they do?
They collaborated with SurveySensum to enhance their website’s user experience and improve NPS.
They had a million users which means they received about 10,000+ responses, per month, on their website. Now, the challenge for them was to prioritize this 10k+ feedback, analyze it, and take action based on its urgency.
The Solution – Step-By-Step Process
They were sending an NPS survey to its users after they had spent an average article read time of 45 seconds. They also set up a survey repetition interval of 30 days.
Here is a glimpse of the NPS question : 
Now, their issue here was, that they were not able to prioritize and analyze such a huge number of survey data.
1. They Analyzed Thousands of Qualitative Feedback with Text Analytics
STEP 1: They trained the ‘SurveySensum’s Text Analytics machine on 100-200 comments creating 7-8 categories those comments might fall in.
STEP 2: Now, every time a keyword or similar words to that keyword appear they should fall into a particular category. This saved them around 40-50 hours of manual analysis which they were spending in a month to read these comments.
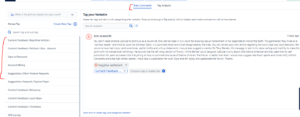
Once the training was finished they ran a text analysis and the results came like below.
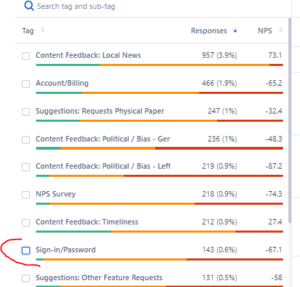
2. Identifying Drivers of Dissatisfaction
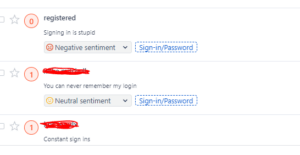
Now, that the tool was trained, it quickly identified the emerging trends and customer complaints which were – ‘Sign-in/Password’ category comprised 10% of comments, with a corresponding NPS score of -67.1.
People were frustrated about why they had to constantly log in.
→ So the score here is 67.1 but how can you know if it is a good score or not when it comes to assessing your performance against your industry industry? With NPS benchmarking. Read more about it!
Recognizing the frustration related to constant logins, they proactively implemented targeted interventions. This recognition prompted them to take focused actions aimed at alleviating the identified source of discontent among the readers and ultimately improving the NPS score.
3. Close the Feedback Loop With Text Analytics
With the identification of the prime complaint among customers, it was time to resolve these issues, hence closing the feedback loop. This was done in two steps:
1. Proactive Interventions and Targeted Actions
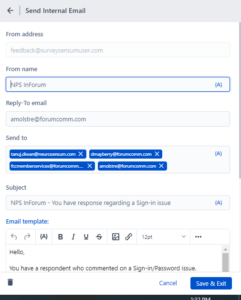
Once the signup issue was highlighted to the product and support team, They promptly set up email notifications for their support team. These notifications were triggered whenever a subscriber mentioned login problems.
Here’s how it was planned;
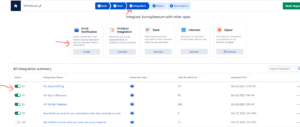
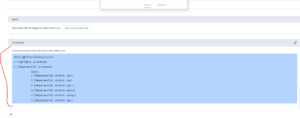
- STEP 1: The NPS survey was integrated with the client’s email address in the survey-builder.
- STEP 2: Then the conditions for login issues and other similar keywords were set up.
2. Implementing NPS Email Notifications
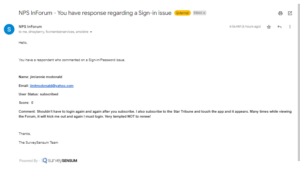
NPS Email notifications were set up and forwarded to the Support team. This allowed them to respond to the readers in time, close the feedback loop in real-time, and identify all possible root causes for login issues.
Here is an email notification when a reader leaves negative feedback.
4. Results and NPS Score Improvement
After running this activity for a month, they figured out the client’s major concerns, fixed them in another month and 2 months later 90% of the issues were resolved. This resulted in an 11-point increase in NPS scores within 3 months.
This case study exemplifies how leveraging technology and data-driven insights can transform user experience and drive positive business outcomes.
What’s Next?
In an ongoing commitment to enhance its user experience and address potential reader concerns, the media company has now set up new notifications. For example, now they send email alerts when readers leave negative reviews about subscription cancellations and other issues.
Analyze & Improve Your NPS With Text And Sentiment Analytics Software
Free Forever • No Feature Limitation • No Credit Card Required • Sign Up For Free ![]()
Frequently Asked Questions
1. What is NPS in data analytics?
NPS is a metric used in data analytics to measure customer loyalty and satisfaction. It is derived from a single-question survey asking customers how likely they are to recommend a company’s product or service to others on a scale of 0 to 10.
2. What is NPS in sentiment analysis?
In sentiment analysis, NPS is used to quantify the emotional tone of customer feedback. While the NPS score itself provides a numerical representation of customer loyalty, NPS text analytics delves deeper into the text-based comments accompanying the scores. By applying natural NLP techniques, sentiment analysis can categorize these comments as positive, negative, or neutral.
3. What is NPS as text message?
NPS as a text message refers to the method of collecting NPS feedback via SMS. This approach involves sending a text message to customers asking them the standard NPS question: “On a scale of 0 to 10, how likely are you to recommend our product/service to a friend or colleague?” Customers respond with their rating via text. This method is particularly useful for reaching customers who may prefer quick and convenient communication channels or those who may not frequently check email.
4. How to analyze NPS data?
Analyzing NPS data involves several steps to gain meaningful insights from customer feedback:
- Calculate the NPS: Calculate the percentage of promoters and detractors. Subtract the percentage of detractors from the percentage of promoters to get the NPS.
- Segment the Data: Analyze NPS scores by different customer segments such as demographics, purchase history, geographic location, or other relevant criteria.
- Identify Trends: Look for trends over time to see if NPS is improving or declining. Plotting NPS scores over time can help identify patterns and the impact of business changes.
- Benchmarking: Compare your NPS with industry benchmarks to see how you stack up against competitors.
Actionable Insights: Use the insights gained from the analysis to identify areas for improvement, prioritize actions, and implement changes to enhance customer satisfaction.
5. How do I analyze NPS data in Excel?
Analyzing NPS data in Excel involves organizing, calculating, and visualizing the data. Here’s a step-by-step guide:
- Organize Your Data: Enter the NPS responses in a column, with each response in a separate cell. Ensure you have the customer ratings and any additional comments in adjacent columns.
- Categorize Responses: Add a new column to categorize each response as promoter (9-10), passive (7-8), or detractor (0-6). Use Excel’s IF function to automate this.
- Calculate Percentages: Calculate the number of promoters, passives, and detractors using COUNTIF. Calculate the total number of responses. Calculate the percentage of each category.
- Compute the NPS: Subtract the percentage of detractors from the percentage of promoters to get the NPS.
Visualize the Data: Create charts to visualize the distribution of promoters, passives, and detractors. Use bar charts, pie charts, or line graphs to display trends over time.
Close the Feedback With SurveySensum’s Text Analytics Software
Free Forever • No Feature Limitation • No Credit Card Required • Sign Up For Free ![]()


