


As part of my series on Making Sense of Our Big Data World, today’s post is on measurement scales. See the overview, Making Sense of Our Big Data World: Statistics for the 99%, to understand the importance and value of understanding statistics and statistical thinking.
We live in a world in which we are quantifying nearly everything. we measure different things and then apply analytics to the numbers to make sense of them. Consider Facebook likes, number of tweets, customer satisfaction and customer loyalty, to name a few things businesses measure and try to understand and predict.
Measurement involves the process of assigning a formal number system to some characteristics of objects or events. The numbers represent the different levels of the characteristic we are measuring. Measurement scales are the means by which we assign the number to the object or entity, and this number represents something about that object or entity that interest us.
Stevens (1951)¹ divided measurement scales into four types: nominal, ordinal, interval, and ratio. The degree to which these scales differ is reflected in the degree to which arithmetic operations make sense with the values of the scales as well as the types of statistical analyses that can be done using the values.
Nominal Scale
A nominal scale categorizes or labels objects. The scale or numbers you use to describe the objects are mutually exclusive; that is, numbers on the nominal scale reflect only that the objects are different from one another. For example, we might use a nominal scale to categorize smartphone manufacturers.
- Apple is assigned a 1.
- Samsung is assigned a 2.
- HTC is assigned a 3.
We may also use a nominal scale to label a set of stores.
- Bob’s Barn is assigned a 1.
- Theresa’s Tent is assigned a 2.
- Stephen’s Store is assigned a 3.
- Marissa’s Mall is assigned a 4.
The only arithmetic operations that can be used on a nominal scale are the equality and inequality operations. For example, within our present store categorization system, a Stephen’s Store (3) is the same as another Stephen’s Store (3). Also 1 ≠ 2 indicates that a Bob’s Barn is not the same as a Theresa’s Tent. Some operations that would not make sense are addition and subtraction. For example, a Stephen’s Store (3) minus a Theresa’s Tent (2) would not equal a Bob’s Barn (1).
Because the values on the nominal scale represent categories, they can also be identified by different symbols, such as letters of the alphabet. For example, a Bob’s Barn might be labeled an “A,” a Theresa’s Tent as “B,” a Stephen’s Store as “C,” and a Marissa’s Mall as “D.”
Ordinal Scale
An ordinal scale uses numbers to order objects with respect to some characteristic. For example, we can place customers in order according to their satisfaction level. If person A is more satisfied than person B, and person B is more satisfied than person C, then person A is more satisfied than person C. Using an ordinal scale, we may assign a number to each of these people and rank them from least satisfied (person C) to most satisfied (person A). The numbers corresponding to this satisfaction ordinal scale could be:
- Person C is a 1.
- Person B is a 2.
- Person A is a 3.
Let’s look at some arithmetic operations applied to ordinal scales. Equality/inequality operations can be applied to ordinal scales. For example, in an equality/inequality operation, we can say that person C (l) is not equal to person A (3). We can also use the operations of less than ( < ) and greater than ( > ) on ordinal scales. Statements such as 3 > 2 and 1 < 3 make sense, indicating that person A is more satisfied than person B and person C is less satisfied than person A, respectively.
Another example of ordinal scales is reflected in the ranking of companies on some variable. For example, in studying a wide variety of companies, a research firm may assess the satisfaction level of its customers. In a final report, the research firm ranks the companies from highest to lowest in terms of its customers’ overall satisfaction level. Suppose the study included five companies. The company with the highest average score on the customer satisfaction questionnaire would be ranked 1; the company with the second highest score would be ranked 2; and so forth: Company A is a 5. Company B is a 4. Company C is a 3. Company D is a 2. Company E is a 1.
Although ordinal scales allow us to order objects, they do not allow us to determine the distance between the objects with respect to the characteristic being measured. For the example of ranking customers with respect to their satisfaction, we know the order of the people but do not know how much more satisfied one person is relative to another. Also, ranking the companies does not tell us how much more satisfied company E’s customers are compared to customers of other companies. This inability to determine differences between objects relates to the ordinal scale’s lack of a unit of measurement.
Interval Scale
An interval scale orders things so that differences between scale values are equal, because the interval scale has a unit of measurement. One example is the Fahrenheit scale.
We can use more arithmetic operations with interval scale values. In addition to the equality/inequality and ordering operations, we can perform subtraction. For example, the difference between 50°F and 40°F equals the difference between 120°F and 110°F.
Attitude questionnaires are assumed to possess the features of an interval scale. If this assumption is true, we can perform useful arithmetic operations with the data from such questionnaires.
Ratio Scale
A ratio scale is similar to the interval scale in that it possesses a unit of measurement. The ratio scale has one additional feature: a meaningful zero point. An example of a ratio scale is the measurement of length. Another example is the measurement of time.
All arithmetic operations are meaningful for the ratio scale. This includes equality/inequality, ordering, subtraction, addition, and division.
Descriptive Statistics and Statistical Analyses
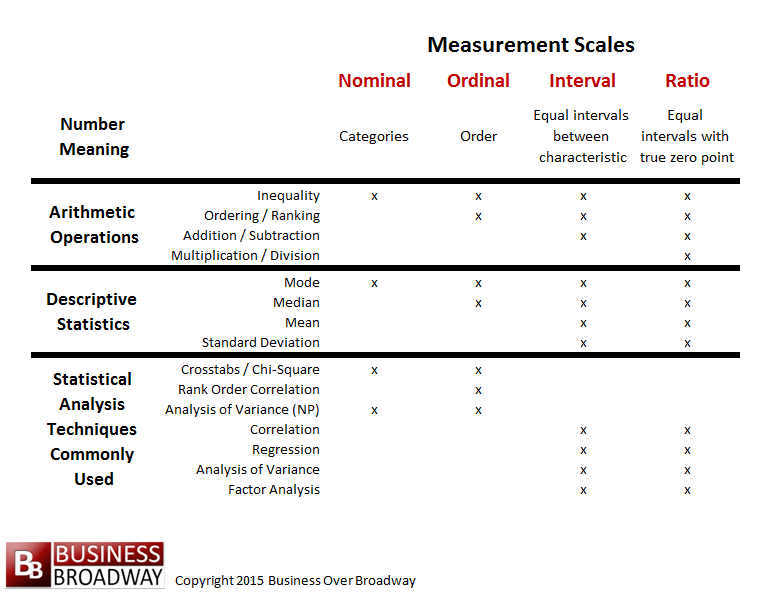
Table 1. Measurement Scales
Big Data is less about the data itself and more about what you do with the data. The application of statistics and statistical principles on the data helps you extract the information it contains. To summarize your data, you can calculate descriptive statistics of different metrics to understand the shape and form of the distributions (e.g., mode, median, mean, standard deviation). Also, to uncover relationships among different metrics, you can apply statistical analyses on your metrics (e.g., regression, factor analysis). The descriptive statistics and statistical analyses you are able to use on your data depends on measurement scales that describe those data. Table 1 contains information about the types of descriptive statistics and statistical analyses you can use for each type of measurement scale.
Summary
Your business data contain a variety of metrics, each representing a particular characteristic of an object or entity (e.g., customer, transaction). To make sense of these metrics, you need to understand the types of measurement scales that are used to represent each metric.
There are four types of measurement scales, nominal, ordinal, interval and ratio. Variables that represent the nominal scale include any type of variable that can be grouped into mutually exclusive groups: customer name, customer marital status, store location, etc. Variables that represent the ordinal scale include any type of variable that can be ordered in some manner. Variables that are described using the interval measurement scale represent things where the differences between scale values are equal. The types of descriptive statistics and statistical analyses you can perform on your data depends on the types of measurement scales you are using.
¹ S.S. Stevens (1951): “Mathematics, measurement, and psychophysics.” In S.S. Stevens (ed.): Handbook of experimental psychology. New York: Wiley
This article originally appeared on CustomerThink.
 Beyond the Ultimate Question
 Measuring Customer Satisfaction and Loyalty (3rd Ed.)
[…] Measurement Scales […]
[…] Sourced through Scoop.it from: businessoverbroadway.com […]
[…] As part of my series on Making Sense of Our Big Data World, today's post is on measurement scales. See the overview, Making Sense of Our Big Dat World: Statistics for the 99%, to understand the importance and value of understanding statistics. […]