


Contents
At its core, NPS is a straightforward metric designed to gauge customer loyalty and satisfaction. Unlike intricate algorithms or convoluted methodologies, NPS is refreshingly uncomplicated. It revolves around a single question – “How likely are you to recommend our product/service to a friend or colleague?”
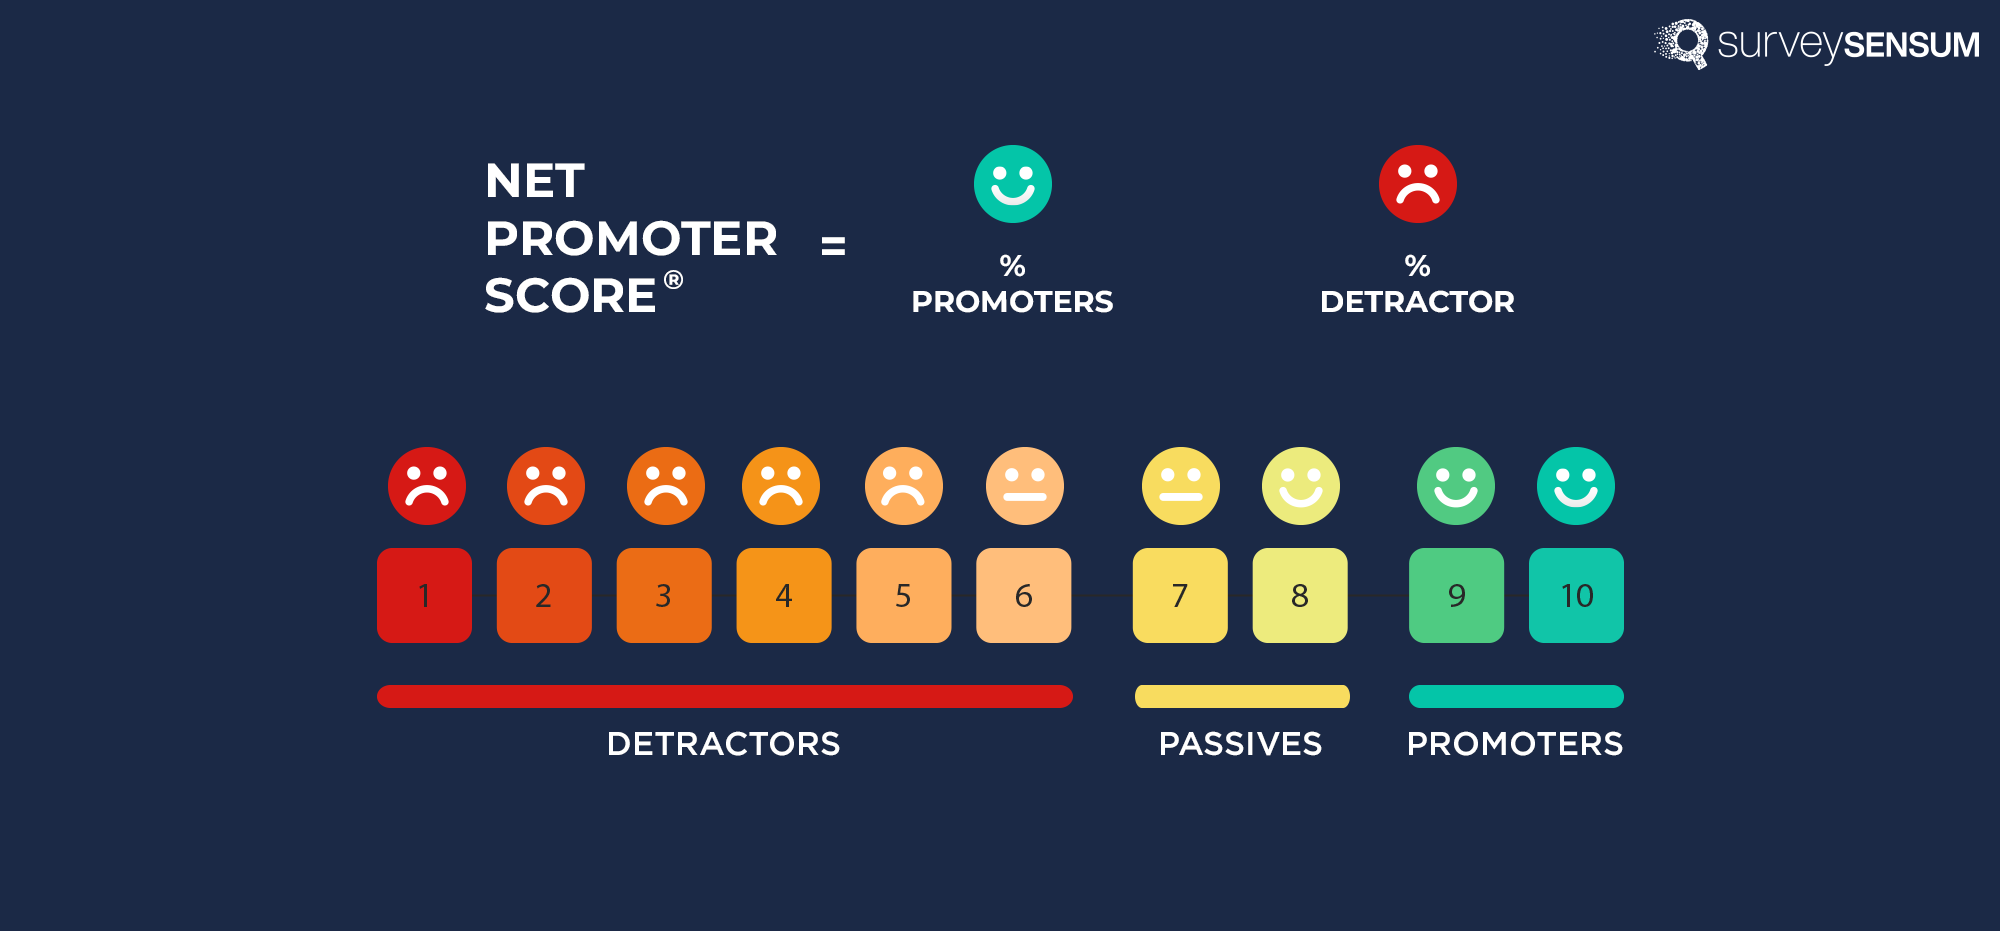
And just like its survey, the NPS calculation is also very simple – just subtract the % of Detractors from the % of Promoters, and voila! You get your NPS score.
But what after that?
Well, let’s scroll down and understand the detailed process of measuring NPS, what is a good NPS score, and ultimately how this calculation will help you improve customer experience and boost customer loyalty.
So, let’s begin with the NPS calculation.
How to Calculate NPS: With NPS Calculator
With efficient NPS calculators, you don’t have to calculate your NPS manually! Put your data in the NPS calculator below, sit back and relax!
NPS Calculator
How To Measure Net Promoter Score: Step by Step SurveySensum?
STEP 1: Choose the Sample
Before sending out your NPS surveys, there are a few questions you need to ask yourself to have a clear vision of your NPS program.
Questions such as:
- What aspect of the business are you looking to improve?
- How to segment your responses and which segment is important? Is it promoter, detractor, or passive?
- Do you have the right NPS tools in place to carry out your NPS program?
- Do you have a system in place to automate mundane tasks?
- Are you ensuring a real-time ticketing system for an in-time closed-loop mechanism?
Now, once you have checked these important points, you can now send out surveys with a clear picture in mind. However, along with sending surveys, you need to ensure a higher NPS survey response rate as more data will help you calculate the NPS score more accurately and help you gain a better picture of customer loyalty.
Step 2: Survey Your Customers

Send out an NPS survey asking customers to rate – “On a scale from 0 to 10, how likely they are to recommend your product, service, or company to a friend or colleague.” Share the survey via multiple channels to ensure you reach a higher NPS response rate.
After you receive your survey response, segment your responses into these 3 categories:
- Promoters: Customers who gave a rating of 9 or 10. Promoters are customers who have given a score of 9 or 10. You can count on these customers as those with high lifetime value and those who will remain loyal to the business for the foreseeable future.
- Passives: Customers who gave a rating of 7 or 8. They are currently loyal to the brand but are at a high risk of churning. Their loyalty is fickle and hence can be easily lured by competitors with better pricing, features, or even a single negative experience from your business.
- Detractors: Customers who gave a rating of 0 to 6. They are a risky lot since instead of spreading positivity about the brand, there is a high chance that they would spread negativity about the brand.
→ Deep dive into which NPS survey questions should you ask!
Step 3: Calculate NPS
Now to calculate NPS, subtract the percentage of Detractors from the percentage of Promoters. The NPS formula is:
NPS = Percentage of Promoters − Percentage of Detractors
For example, if 70% of respondents are Promoters and 15% are Detractors, the NPS would be;
70% − 15% = 55%.
Step 4: Interpret the Score
NPS can range from -100 to +100. A positive score indicates more promoters than detractors, suggesting overall positive sentiment and potential for growth. A negative score suggests more detractors than promoters, indicating areas for improvement.
Detractors highlight pain points and areas of improvement in your product and overall business. So, use text analytics software to categorize these pain points into different categories and get a holistic view of your customer satisfaction. Now, use this data to extract action plans to improve your business and exceed customer expectations.
So, calculate and analyze your NPS score and boost your customer loyalty with SurveySensum!
Free Forever • No Feature Limitation • No Credit Card Required • Get a Live Demo ![]()
Now, you have your score, but to determine whether it is good or bad? Let’s find out.
What is a Bad NPS Score?
As a rule of thumb, anything below the score of 0 is a negative NPS score and is definitely worrisome. A negative NPS score means that you have more unhappy customers than those who enjoy your products or services. Simple!
Let’s take an example to explain such cases of the net promoter score.
Telecommunications giant Comcast has traditionally had poor NPS scores. It had a score of -3 in 2019. In fact, their customer service is considered so shoddy that they even had to promise US senators in 2016 that they would fix its service issues. Sadly, their NPS score is still negative.
Now, that we understand what is a bad NPS score, let’s see what is a good NPS score.
What is a Good NPS Score?
We know that anything below 0 is a negative NPS and is not a very good sign for businesses. So, let’s explore the positive NPS score and its categorization to determine whether or not you have a good NPS score.
- NPS of 70 or Higher: This is often considered excellent and suggests that a company has a strong base of loyal customers who are highly likely to recommend its offerings to others.
- NPS of 30 and Up: This range is still regarded as good, indicating that the company has a solid foundation of satisfied customers who are generally willing to recommend it.
- NPS between 0 and 29: While positive, this range suggests room for improvement. It signifies that the company has more satisfied customers than dissatisfied ones but may not have fully tapped into its potential for customer advocacy.
However, the average NPS varies significantly from industry to industry. So, what constitutes a good score for NPS score for the hospitality industry may not apply to the retail industry.
Step-by-Step Process on NPS Benchmarking – Download Now!
But why measure NPS? Let’s see.
Why Measure NPS?
1. Assessment of Customer Satisfaction
Let’s start off easy – the first and foremost benefit of measuring NPS is that you get a clear and holistic view of what your customers experiencing and whether or not they are satisfied with it. Now, as a general rule of thumb, the higher the score is, the greater the number of happy customers you have.
Not only does NPS give you a clear picture of your happy customers, but it also gives insight into unhappy ones and why they are unhappy and potentially at risk of churning. This helps businesses identify areas for improvement and prioritize efforts to retain customers at risk of churning.
2. NPS Trends with Historical NPS
You have been measuring and analyzing your NPS score for a decade now and also making changes based on that feedback, but is it really working? Is your customer’s perception of you changing or is it the same?
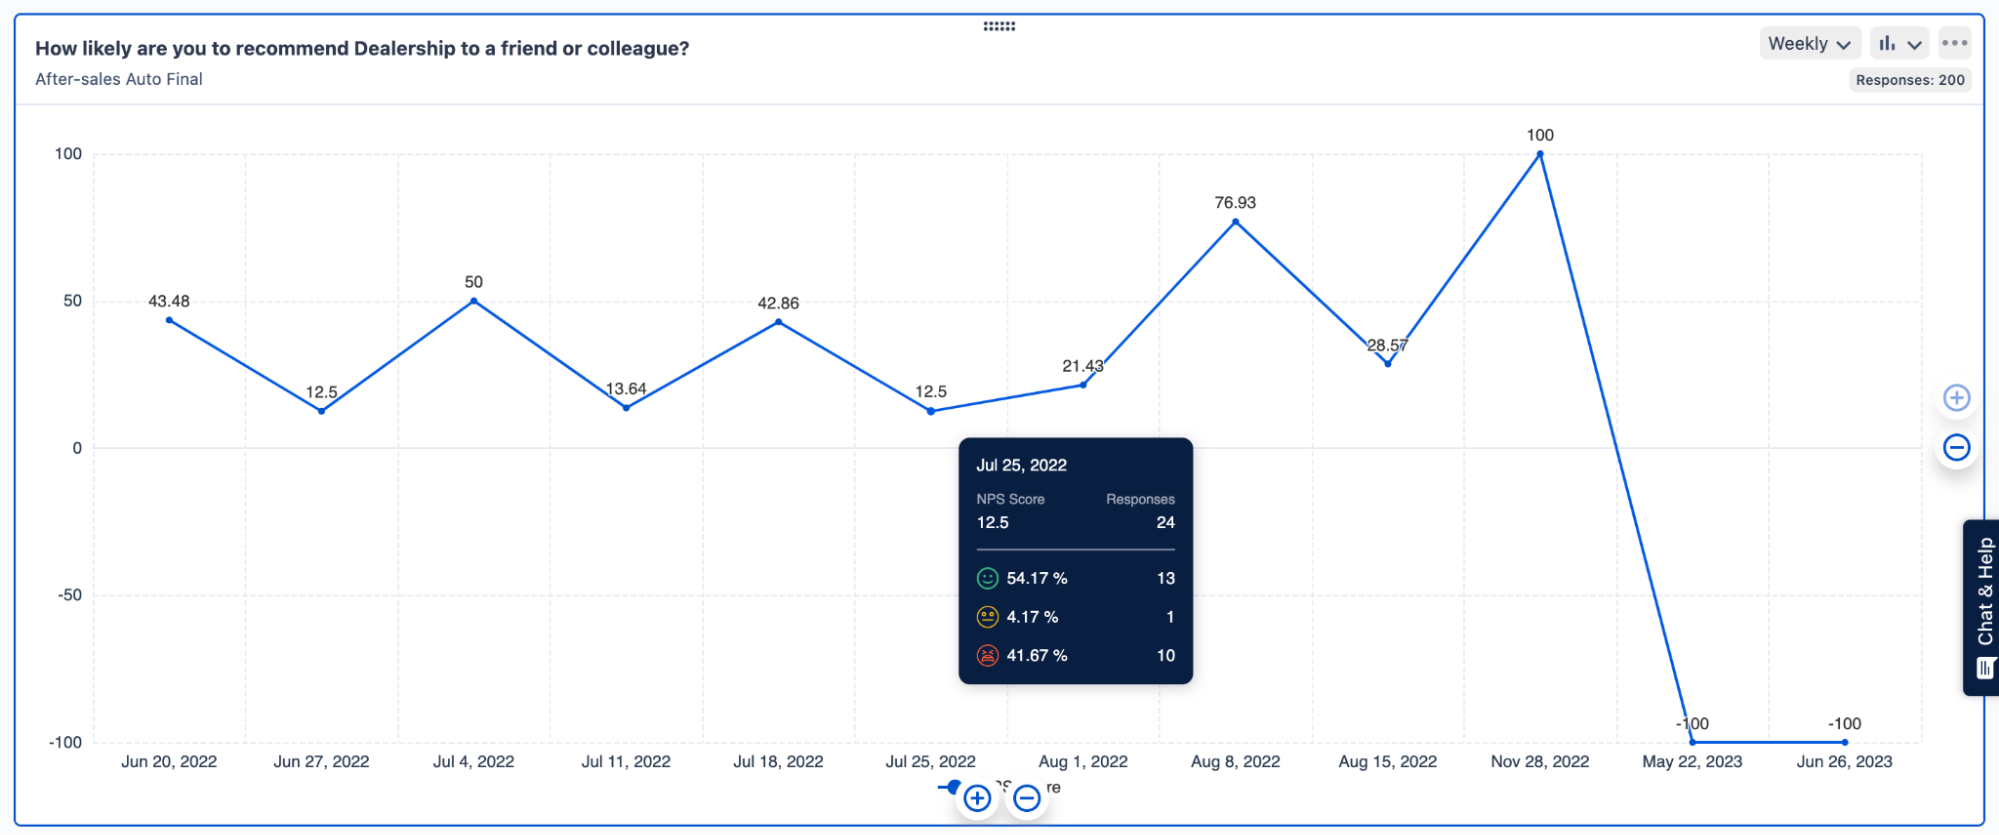
This is where measuring and tracking NPS over time comes to your rescue. When you track NPS over time, it provides you insights into the trajectory of customer satisfaction and loyalty — helping you discern patterns and trends in customer sentiment and understand what’s working and what’s not!
3. Identifying Areas of Improvement
The whole shenanigan of measuring and calculating your NPS score remains half-baked if you don’t actually put it to use.
Your NPS responses are a goldmine of actionable insights and if analyzed properly businesses can pinpoint specific areas that require attention. Whether it’s enhancing product features, improving customer service, or streamlining processes, NPS provides valuable guidance for making targeted changes that align with customer preferences and needs.
But the question that arises here is – what to do after NPS calculation? Let’s see.
Analyzing and Acting on NPS Score
So, now you have collected the NPS survey data and did your NPS calculation, but what to do with the score? How to utilize it and create effective action plans to boost customer satisfaction? Let’s see.
-
Compare Your NPS Score To Your Industry Average
So, do you think you have a “good” NPS score? Are you sure?
NPS is relative and until you have compared your NPS score with your industry average, you cannot be certain that you have a better NPS score than your competitors.
For example, if you are in a SaaS business and have a 65 NPS score, doesn’t necessarily mean that you are doing better than your competitors. If other businesses in your industry are constantly retaining customers at a high rate then they are likely attracting more customers than you.
Discover more about NPS benchmarks and improve your NPS score.
Step-by-Step Process on NPS Benchmarking – Download Now!
2. Identify Key Areas, and Align Them With the Operational Data
Dive deeper into the NPS feedback to identify specific areas that drive customer sentiment, such as product features, customer service interactions, or overall user experience. Align this qualitative feedback with operational data, such as sales metrics or customer support tickets, to gain a comprehensive understanding of underlying issues and opportunities for enhancement.
3. Analyze Trends
Track NPS trends over time to identify patterns and shifts in customer sentiment. Are there fluctuations in NPS scores after certain events or product releases? Analyzing trends can provide valuable insights into the effectiveness of your initiatives and help predict future customer behavior.
Use a robust NPS tool with advanced text analytics software that will automate the process of identifying and analyzing trends in your feedback and provide you with detailed insights into your customer sentiments. This will help you identify areas of improvement and extract actionable insights.
4. Close the Feedback Loop
Share your NPS results and improvement initiatives with key stakeholders within your organization. Transparency about customer feedback and efforts to address it fosters a customer-centric culture and alignment across teams.
Here’s how you can close the feedback loop.
- Segment Feedback:
Segment your NPS feedback based on demographics, purchase history, or other relevant criteria. This can help you identify specific customer segments that are driving your NPS score and tailor your strategies accordingly.
- Engage with Promoters:
Reach out to promoters to express appreciation for their support and loyalty. Encourage them to continue advocating for your brand by participating in referral programs, leaving positive reviews, or providing testimonials.
- Resolve Detractors’ Concerns:
Prioritize addressing the concerns of detractors to improve their satisfaction and loyalty. Reach out to gather feedback, resolve issues, and demonstrate your commitment to customer satisfaction. Turning detractors into promoters can have a significant impact on your overall NPS score.
- Engage with Passives:
While passives may not be as enthusiastic as promoters, they still provide valuable feedback. Engage with passives to understand their reasons for not being more enthusiastic and identify opportunities for improvement.
- Implement Improvements:
Use the insights gained from your NPS analysis to implement targeted improvements to your products, services, or customer experience. Focus on areas that will have the greatest impact on customer satisfaction and loyalty.
How Can NPS Survey Software Help?
An efficient NPS tool will not only help you carry out your basic survey practices but also come loaded with advanced features like cross-tab analysis, automated data capabilities, and analytical dashboards to ensure you get a holistic view of your progress without manual labor.
SurveySensum’s NPS software, allows you to launch and manage your NPS program and improve your NPS in 5 easy ways:
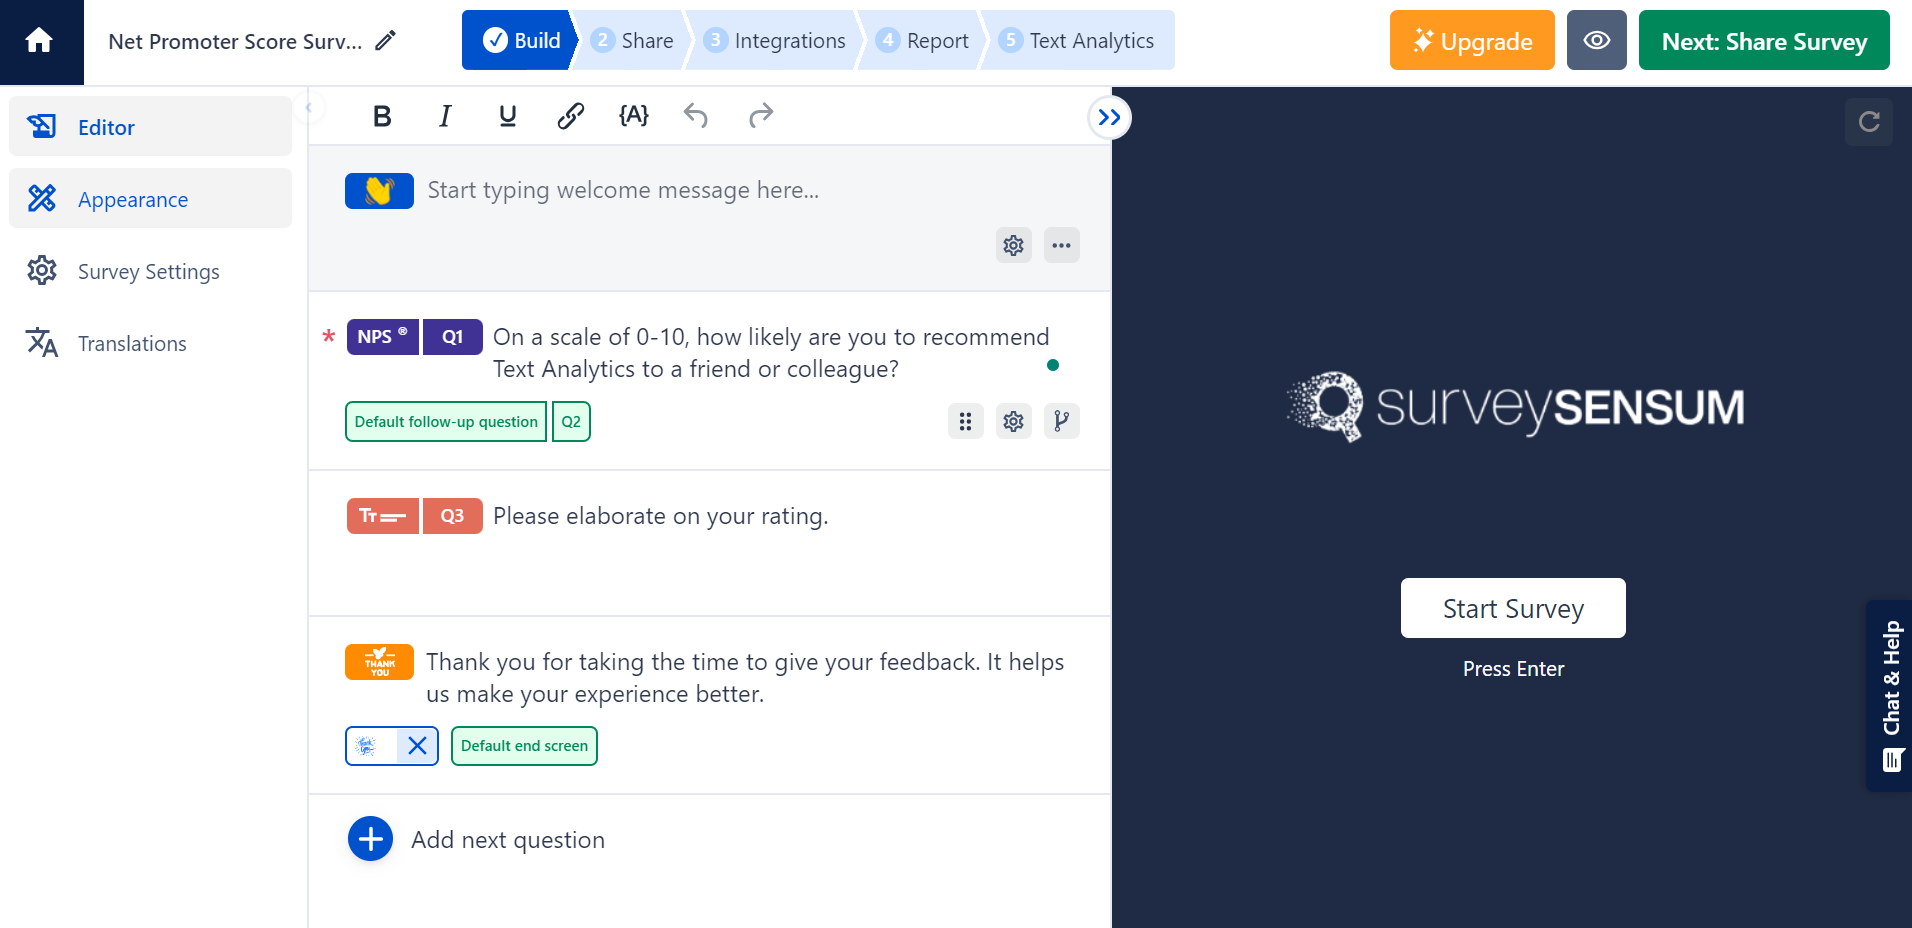
1. Survey Creation: Customers can create powerful and easily customizable surveys that deliver their brand messaging, in just under 5 minutes, with the tool’s easy-to-use survey builder interface.
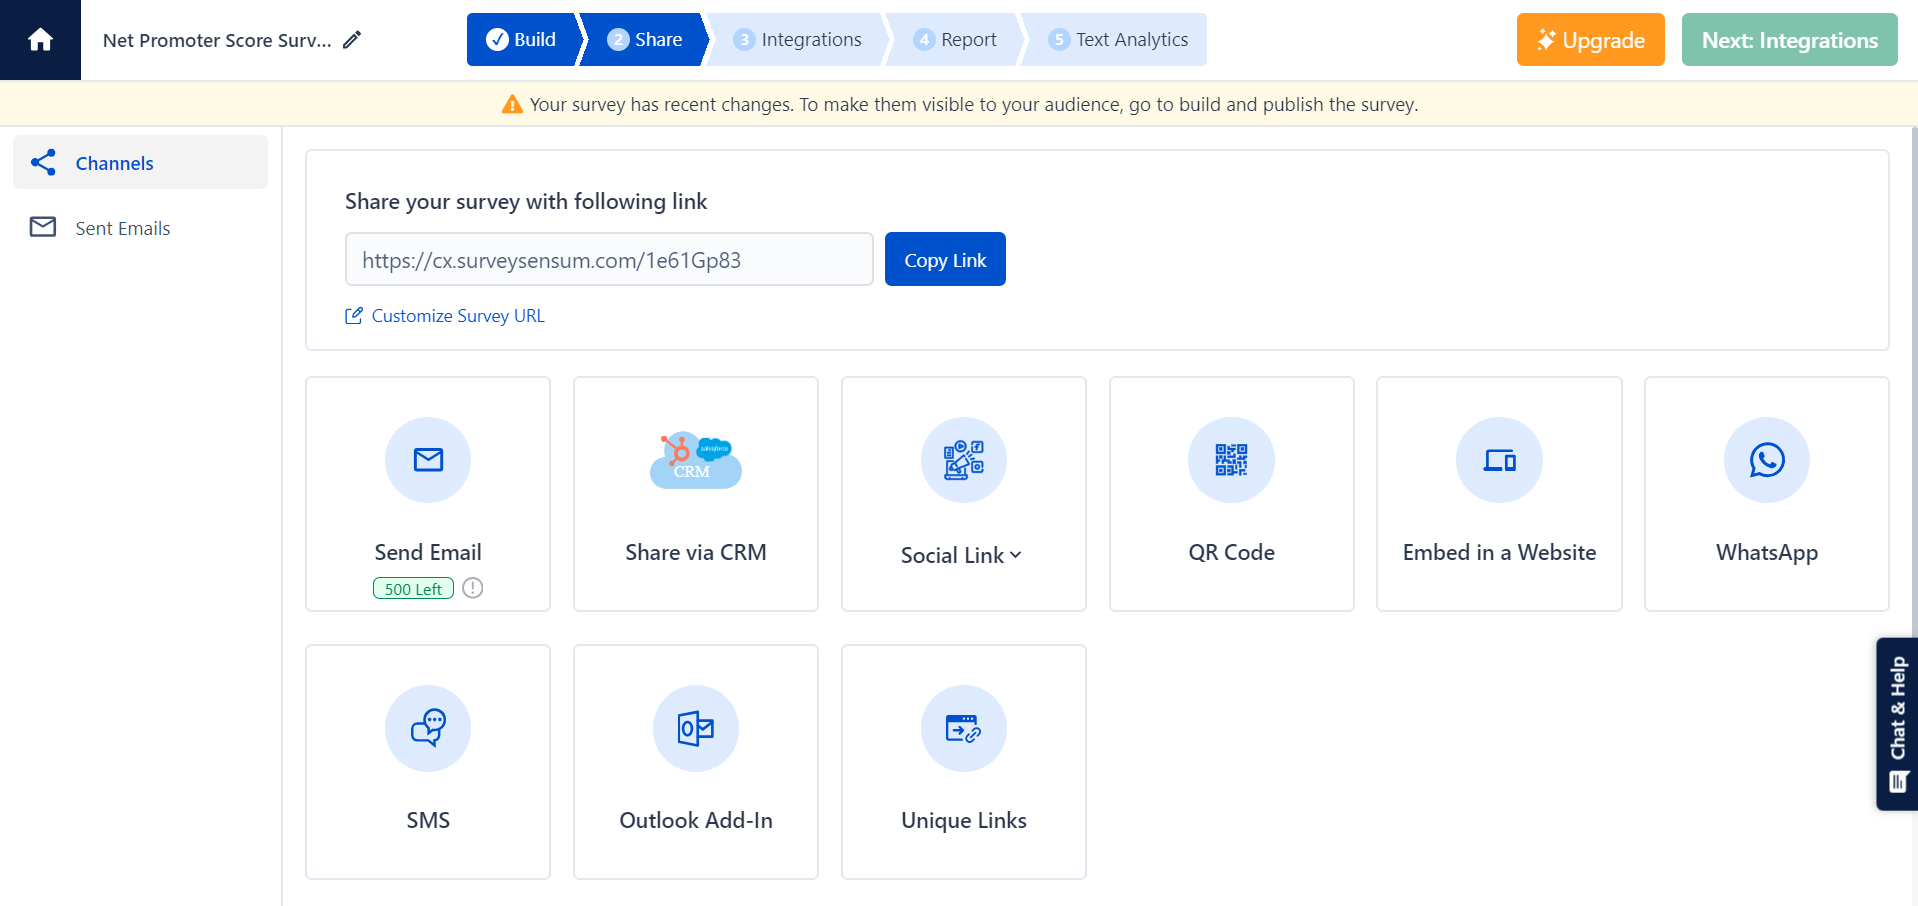
2. Multi-Channel Survey Sharing: Customers can share NPS surveys via multiple channels including emails, WhatsApp, QR codes, messages, etc. This ensures that businesses meet their customer where they are.
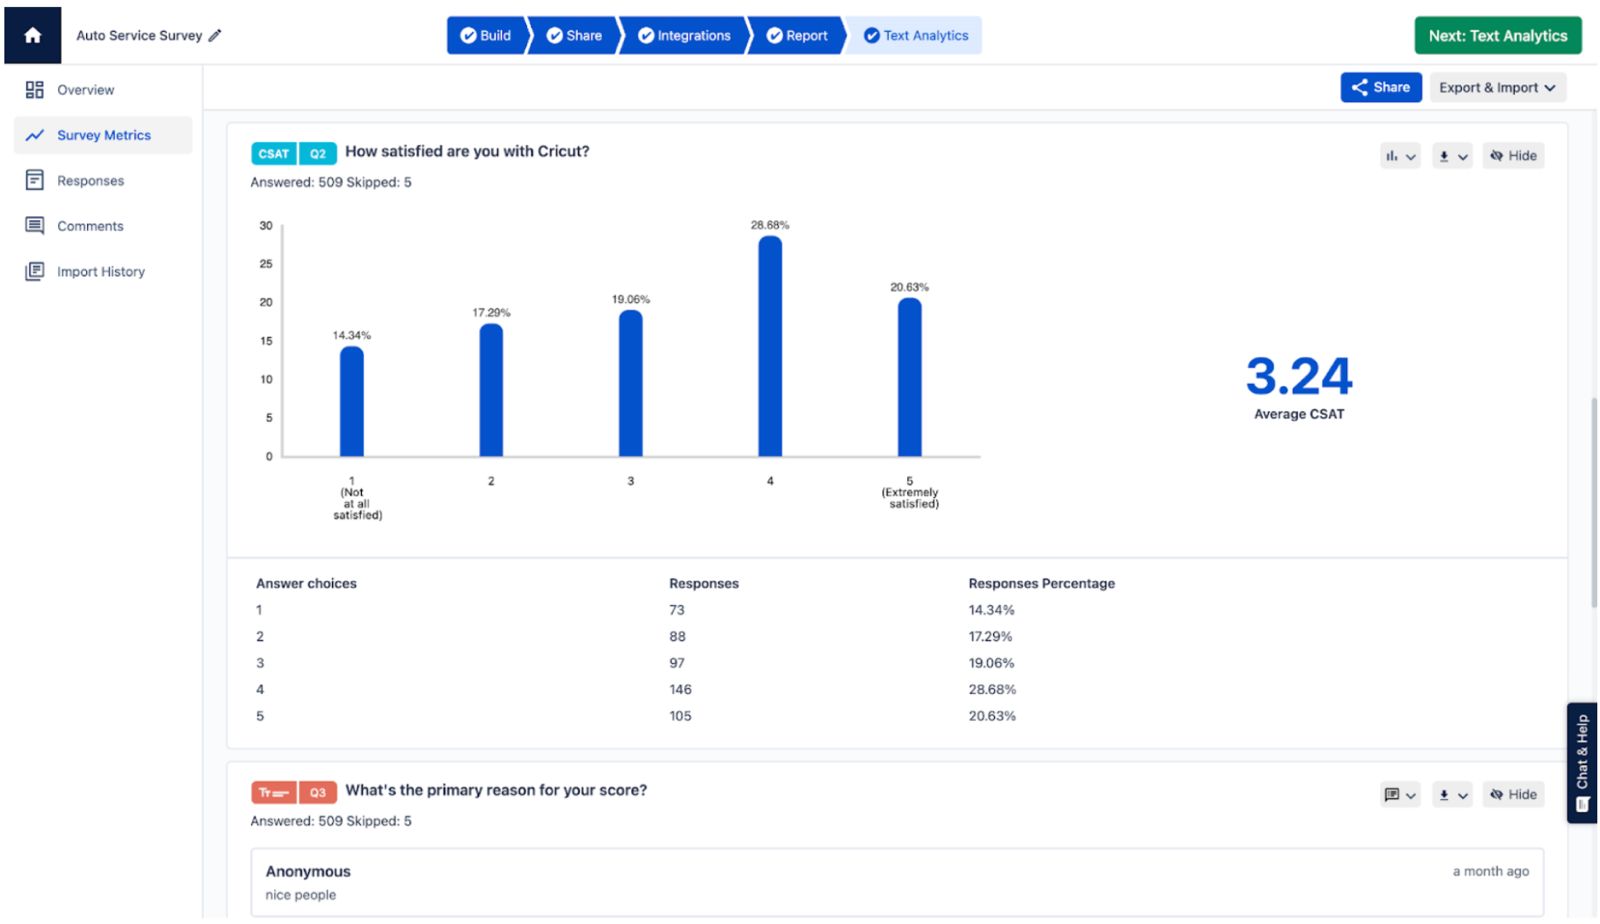
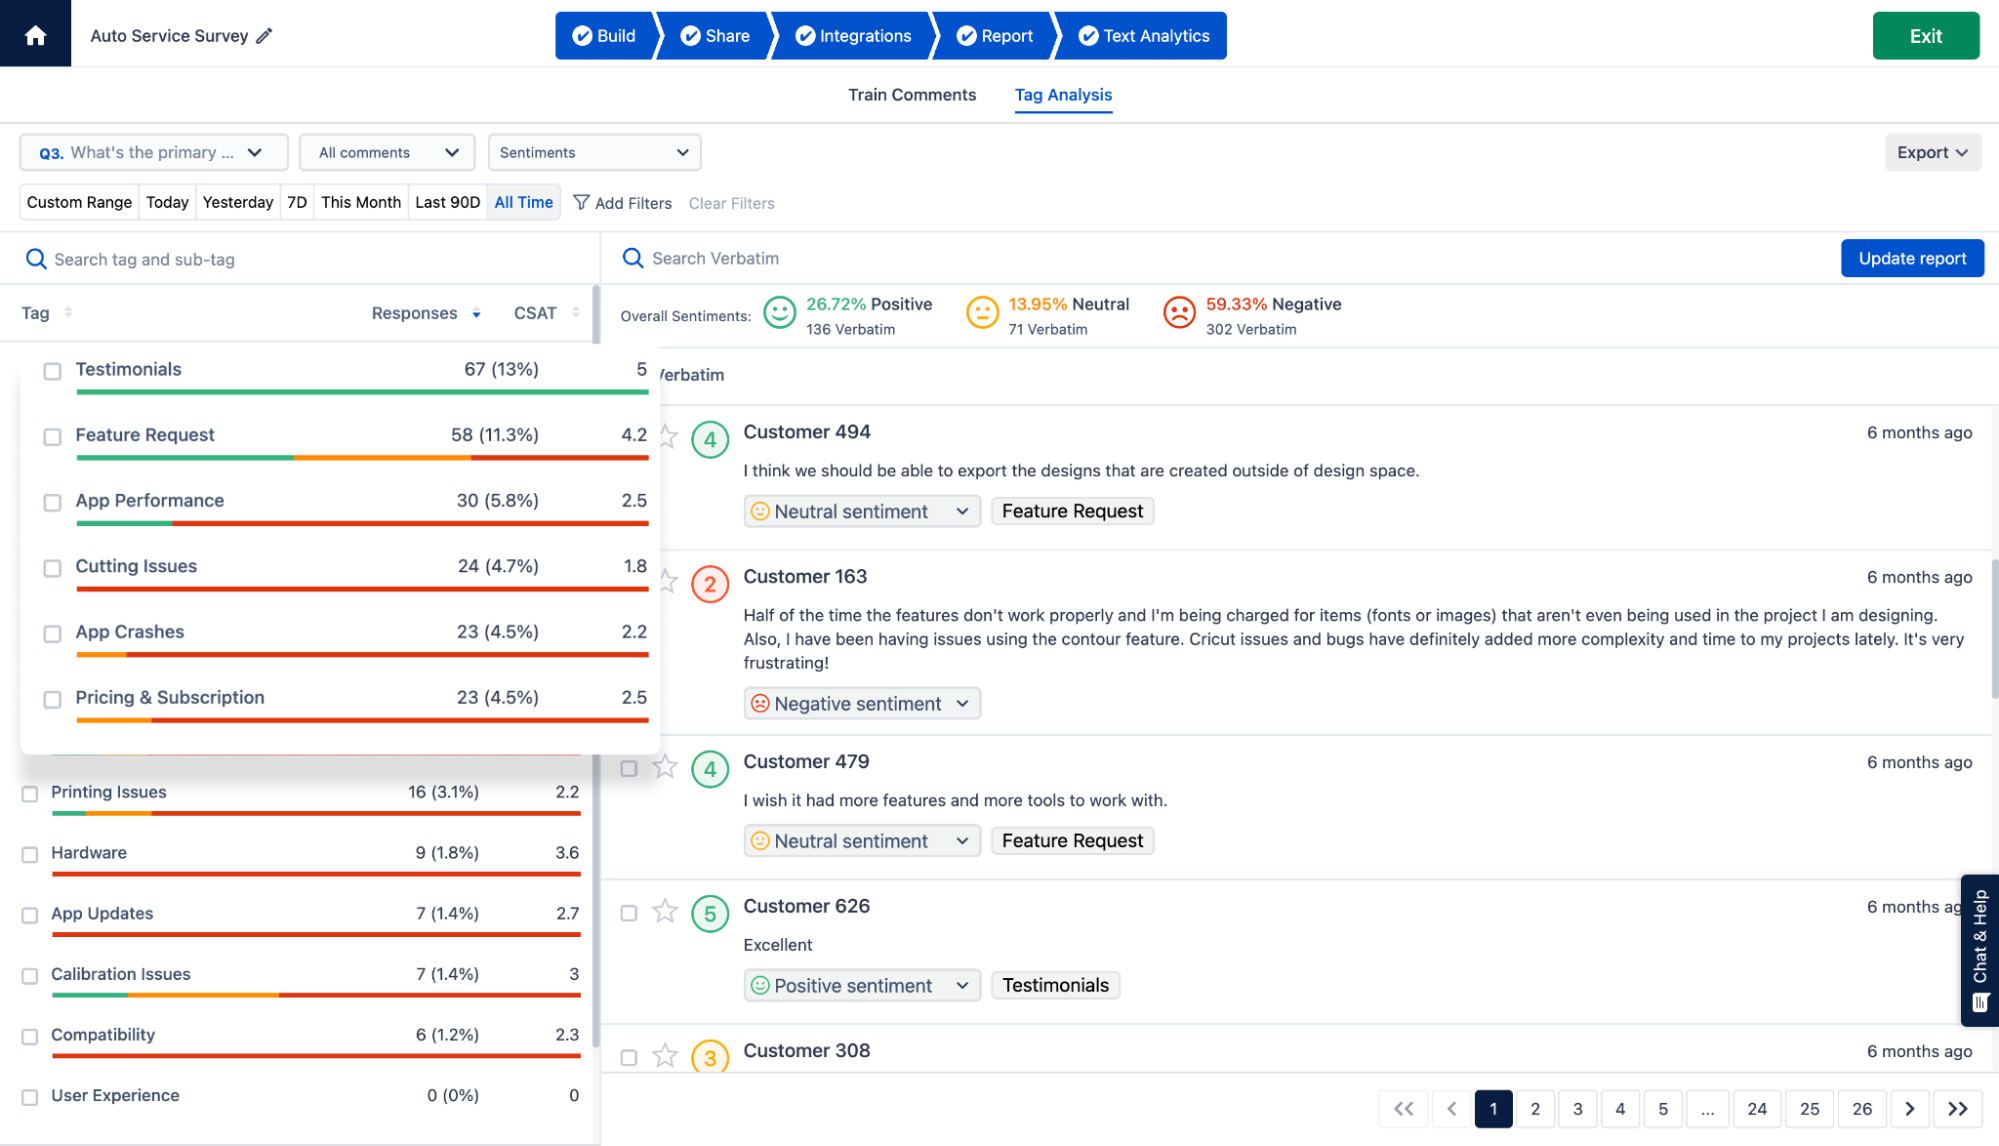
3. Text Analytics Software: The AI-enabled text and sentiment analysis enables users to automate the process of identifying and analyzing customer feedback. The tool can analyze thousands of feedback in a matter of minutes and present a detailed and analytical NPS report on emerging customer sentiments.
4. Real-time Ticketing System: Whenever a customer leaves negative feedback, the system triggers an alert for the team to follow up and resolve in real-time with a 2-hour SLA. If the issues remain unresolved, then the ticket is escalated to higher management. This ensures that issues are resolved in a timely manner.

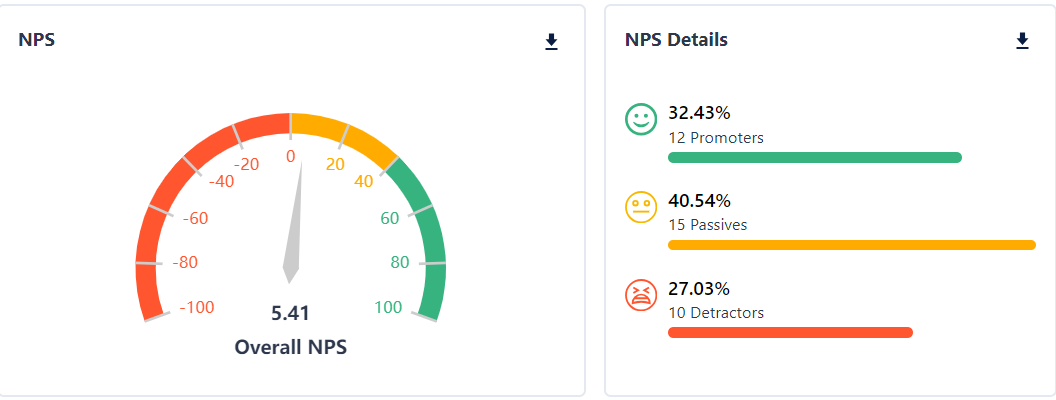
5. Analytical Dashboard: Monitoring improvements becomes easy with a flexible and analytical survey dashboard with pre-configured reports and filters to segment customers by their ranking and identify areas of improvement. It also gives you a bird’s eye view of your entire NPS program.
Launch, analyze, and improve your NPS score with SurveySensum’s CX experts and beat the competition!
Free Forever • No Feature Limitation • No Credit Card Required • Sign Up For Free ![]()
6 NPS Calculation Mistakes You Need To Avoid
Here are some common mistakes you need to avoid while doing NPS calculations.
1. Surveying Everyone
More often than not, businesses make the mistake of not having a clear goal from the beginning. They don’t target specific customer segments for NPS surveys and send surveys to everyone which results in bias and collection of relevant data.
By ensuring that decision-makers, influencers, and end users are all included in the survey process, you can better understand customer sentiment and make informed decisions to improve customer satisfaction and loyalty.
2. Ignoring Open-Ended Feedback
If you are not including open-ended questions in your NPS surveys, then you are missing out on actionable insights.
For example, if a customer rates you 3 on a scale of 1-10, now that’s clearly a detractor, on the verge of churning, but how would you know the reason behind the rating with an open-ended question?
Open-ended questions allow customers to provide qualitative feedback, giving insights into what they like or dislike about your product or service. Analyzing these comments can provide context and actionable insights to improve the NPS.
3. Not Segmenting Responses
Each segment of customers gives varying NPS scores and feedback, now treating all responses equally will actually prevent you from extracting actionable insight.
For example, a customer who recently bought your product and has rarely used it gave you a 9 score and you treat the response as a promoter, do you think that’s relevant? No, because the customer rarely uses your product so the score doesn’t actually highlight satisfaction with the product.
Segmenting responses allows for targeted actions to address specific customer needs and preferences.
4. Recording One Response Per Customer
Limiting NPS calculations to feedback from only one individual overlooks the complexity of customer relationships and fails to provide a comprehensive understanding of the health of each customer relationship. Basing the score solely on the feedback of one decision-maker neglects the influence of other stakeholders who may also impact the relationship.
By incorporating feedback from decision-makers, influencers, and end users, companies can gain a more comprehensive understanding of customer satisfaction and improve their ability to retain and grow business relationships.
5. Solely Focusing on Calculation and Not on Actionable Insights
NPS is not just a number – it’s a tool for driving improvement and growth. Merely calculating the score without interpreting its implications or taking actionable steps based on the feedback renders the whole program ineffective.
This is why instead of solely focusing on the NPS score and calling it a day, organizations should prioritize deriving actionable insights from NPS data to enhance customer satisfaction and loyalty. This will them maintain that good score and prevent customers from churning.
6. Ignoring Passives and Non-Respondents
Passives and non-respondents are often overlooked, as they fall between promoters and detractors. However, understanding why passives aren’t fully satisfied or why some customers don’t respond can uncover opportunities for improvement. Ignoring these groups means missing out on valuable feedback that could help enhance the overall customer experience.
Tip: Capture attention and engage respondents more effectively by color-coding your NPS scale.
Conclusion
Through accurate calculation, interpretation, and effective utilization of NPS scores, businesses can identify areas for growth, nurture customer relationships, and foster a culture of customer-centricity. Leveraging NPS as a guiding metric empowers organizations to not only measure success but also actively enhance customer experiences, strengthen brand loyalty, and ultimately, drive sustainable business growth.
To achieve success in your NPS program, you need efficient NPS software, like SurveySensum that will not only help you create and launch effective NPS surveys with industry-specific survey templates but also help you with NPS calculation and analysis to identify areas of improvement. Not only that, the platform also comes with expert consultation from top NPS experts on how to create successful action plans and achieve business goals.
Launch Your NPS Program With SurveySensum!
Free Forever • No Feature Limitation • No Credit Card Required • Sign Up For Free ![]()
Frequently Asked Questions
1. What is the formula for NPS?
The Net Promoter Score (NPS) is calculated by subtracting the percentage of Detractors from the percentage of Promoters. The formula is as follows:
NPS = % Promoters − % Detractors
2. How do you calculate NPS 1 to 5?
NPS traditionally uses a scale from 0 to 10. However, if you’re using a scale of 1 to 5, you can still calculate NPS. First, categorize your responses into Promoters (4-5), Passives (3), and Detractors (1-2). Then, calculate the percentage of Promoters, Passives, and Detractors, and use the NPS formula mentioned above.
3. How is NPS measured?
NPS is measured by conducting surveys where customers are asked to rate, on a scale from 0 to 10, how likely they are to recommend a company’s product or service to others. Based on their responses, customers are categorized into Promoters, Passives, and Detractors. The NPS score is then calculated from these categories.
4. How do you calculate NPS in Excel?
To calculate NPS in Excel, you first need to gather survey data and categorize responses into Promoters, Passives, and Detractors. Then, you can use Excel functions to calculate the percentage of each category and apply the NPS formula to obtain the final score.
5. What is a good NPS score?
NPS scores can range from -100 to +100. A positive score indicates that you have more Promoters than Detractors, while a negative score means the opposite. Generally, a score above 0 is considered good, with higher scores indicating stronger customer loyalty and satisfaction. However, what constitutes a “good” score can vary by industry and should be benchmarked against competitors or industry standards for better context.