


Did you know that 52% of customers are ready to pay more if they receive exceptional customer service?
Customer service is the backbone of any successful business. It’s what keeps customers happy and loyal.
But here’s the challenge: How do you consistently provide excellent customer service?
By collecting customer feedback!
How exactly?
It helps you identify where exactly are the gaps between your service and customers’ expectations. And that’s not all – with the right customer feedback tool, you can streamline this process, making it quicker and more effective.
Now that you’ve understood the need to enhance customer service let’s talk about improving it.
— Introducing Customer Service Metrics
In simple words, Customer Service Metrics help you gauge the effectiveness of your customer service.
These metrics encompass a range of factors such as response time, resolution time, customer satisfaction scores, and more, offering a comprehensive understanding of how well a company’s customer service efforts are performing.
But why should you focus on them?
Why are customer service metrics important?
These metrics will help you answer critical performance queries such as:
- How well are your support teams delivering top-notch service?
- To what extent do your brand, product, or service messages resonate with customers?
- How user-friendly is your engagement process for customers?
But with the ever-changing face of customer service, you need to keep upgrading your strategies. On that note, let’s talk about the changing face of customer service.
The Changing Face of Customer Service
Imagine walking into a bustling café where the baristas anticipate your order before speaking. That’s the personalized and efficient service today’s customers expect—not just at their favorite coffee shop but across every interaction with brands.
This shift isn’t just a preference; it’s driven by technology. Customers have come to appreciate the convenience of solving issues independently using smart self-service tools. Waiting for assistance feels outdated when intuitive solutions are at their fingertips.
But here’s the twist: technology isn’t replacing human touch. In fact, it’s amplifying it. People want the best of both worlds—high-tech solutions and an empathetic touch.
Up to 40% of customers explicitly want ‘better human service.’
Businesses that understand and embrace these shifts have a secret weapon: they’re ahead of the game. They adapt seamlessly to these changing customer service trends, offering experiences that meet and surpass expectations.
And now, as we delve deeper, let’s uncover the 10 crucial customer metrics that will keep your customers delighted and your business thriving.
10 Customer Service Metrics to Track in 2024
Navigating through numerous service metrics can be overwhelming. The challenge lies in selecting the most relevant ones for your business that aligns with your KPIs.
So here are the top 10 Customer Service Metrics that you should consider tracking in 2024.
1. Customer Satisfaction
The Customer Satisfaction Score, or CSAT Score, is a metric companies use to determine how satisfied customers are with your business. It’s a helpful way to ensure customer retention and product repurchase.
Why to measure – CSAT metrics help companies gauge the effectiveness of their customer service efforts, allowing them to make data-driven decisions that positively impact overall customer satisfaction and, consequently, business success.
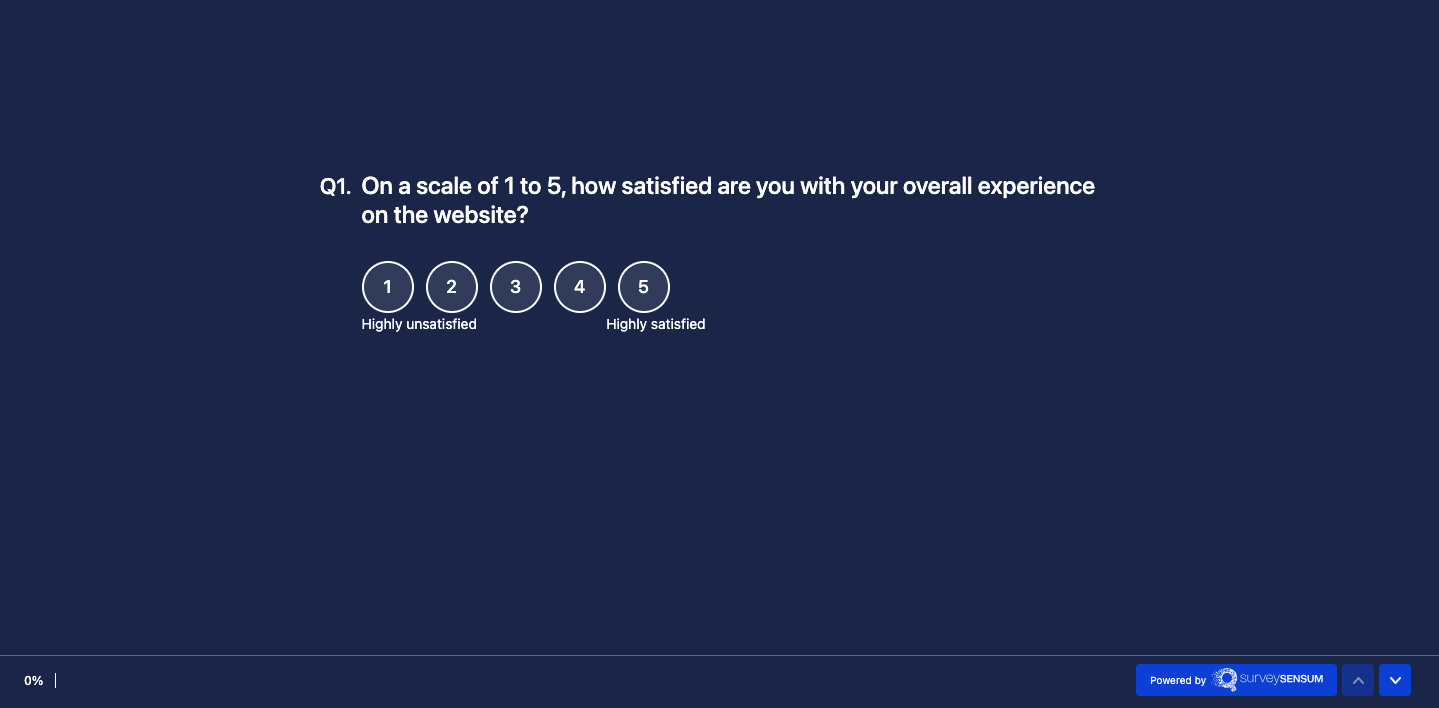
How to measure: Send CSAT surveys post customer interactions (like support calls, chat sessions, or email exchanges) and administer a survey prompting customers to rate their satisfaction.
The survey asks questions such as “On a scale of 1 to 5, how satisfied are you with your overall experience on the website?” with response options spanning from “Highly unsatisfied” to “Highly Satisfied.”
How to calculate: Calculate the CSAT score by dividing the count of positive responses (e.g., ratings of 4 and 5) by the total responses, then multiplying by 100.
CSAT score % = (Number of positive responses / Number of total responses) x 100
For example, if you received 50 positive responses out of 100 total responses, the CSAT score would be 50% (50/100 * 100).
2. Net Promoter Score
The Net Promoter Score is a metric used by businesses to measure customer loyalty and satisfaction and helps identify areas for improvement.
Why to measure – Tracking NPS metrics allows businesses to analyze customer sentiment, uncover potential areas for growth, and understand the likelihood of customer referrals, ultimately helping refine strategies and enhance customer experiences.
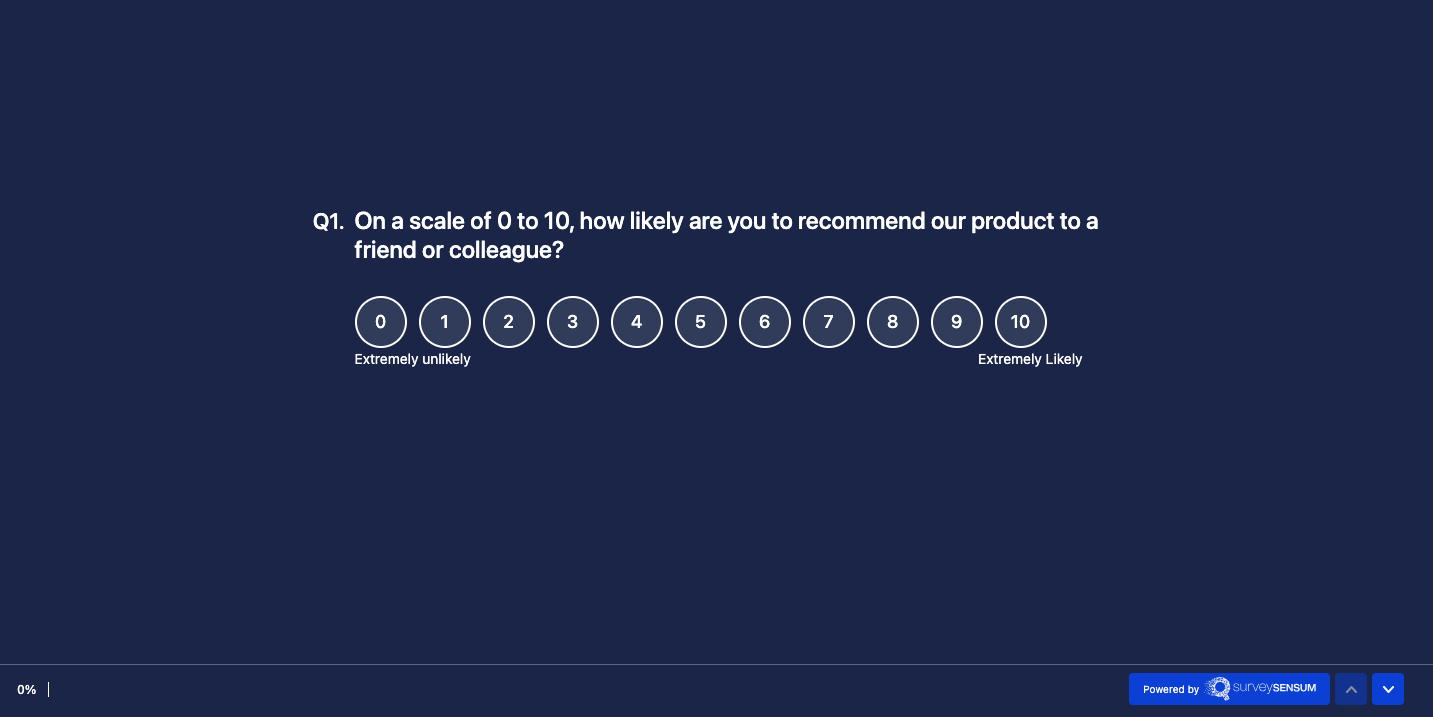
How to measure: The NPS Survey asks questions like, “On a scale of 0 to 10, how likely are you to recommend our product or service to a friend or colleague?“ People giving high scores (9-10) are called Promoters, medium scores (7-8) are Passives, and low scores (0-6) are Detractors.
How to calculate: Find your NPS score by subtracting the percentage of Detractors from the percentage of Promoters. The formula is NPS = % Promoters – % Detractors. The score you get can be between -100 and +100.
NPS = % Promoters – % Detractors.
For example, if 20% of the respondents are Detractors, 10% are Passives, and 70% are Promoters, your NPS score would be 70-20 = 50. This score reflects areas for improvement.
Apple, the famous tech company, uses the Net Promoter Score (NPS) to see how much customers like their products and if they’d tell others about it. They ask a simple question: “On a scale from 0 to 10, how likely are you to tell a friend about Apple?” People who say 9 or 10 are big fans, while those who say 0 to 6 are not so happy.
Apple figures out its NPS by removing the percentage of detractors from the percentage of promoters. By watching this score, Apple can see if most customers like them. This helps them make plans to change detractors into promoters, keep their loyal customers, and improve their business.
3. First Response Time
Did you know that 80% of customers expressed a desire for faster responses from businesses on their issues or queries?
When customers ask a question or problem, they want a quick reply. That’s why measuring the time it takes to respond to a customer’s issue helps ensure their issues are resolved in time.
It’s a nice gesture to send an automatic message to show we got their message. But what matters is how fast and easily we act on their message.
Why to measure – Measuring the First Response Time is essential because it indicates how quickly a business responds to customer queries or concerns. This metric reflects the efficiency of customer support and can significantly impact customer satisfaction and overall experience.
How to measure: Keep track of when a customer sends a request (like an email or chat) and when they get the first response. Find the average FRT by adding all the response times and dividing by how many customers reached out.
First Response Time = (Sum of response times for all queries/Total number of queries)
4. Resolution Rate
When a customer reaches out with a question or problem, your aim is to close the loop. If you can’t help or don’t respond, the customer might not want to come back. An increased resolution rate shows how good your support team is, so it’s an important thing to check.
Why to measure – Measuring the Resolution Rate is crucial as it provides insights into how effectively and efficiently customer issues are being addressed and resolved. By tracking this metric, businesses can gauge their customer service performance and identify areas for improvement, ultimately enhancing overall customer satisfaction and loyalty.
How to Measure: Find how many customer interactions end with a solution. Divide this number by the total interactions, then multiply by 100 to get the resolution rate percentage.
Resolution Rate = (Number of resolved cases/Total number of cases)×100
Tip: Look at the common questions or problems in the data. Use this info to make a FAQ or a helpful guide. This way, customers can solve things on their own or get help.
Southwest Airlines, a big airline in the U.S., uses Resolution Rate to check how good they are at fixing customer problems, like booking flights or dealing with luggage issues, right from the start when customers get in touch.
With a high-resolution rate, it ensures that passengers get help fast and have a good experience, which helps them like the airline more and keeps them coming back.
5. Customer Effort Score (CES)
The Customer Effort Score, or CES, measures how much effort customers have to put into using a product or getting help. This helps them figure out if it’s easy, a bit hard, or tough for them to do what they want. It’s all about making sure things are easy for customers!
Why to measure – This metric helps gauge the effort customers exert to resolve issues or complete transactions. By understanding and optimizing this experience, businesses can enhance customer satisfaction, loyalty, and overall brand perception.
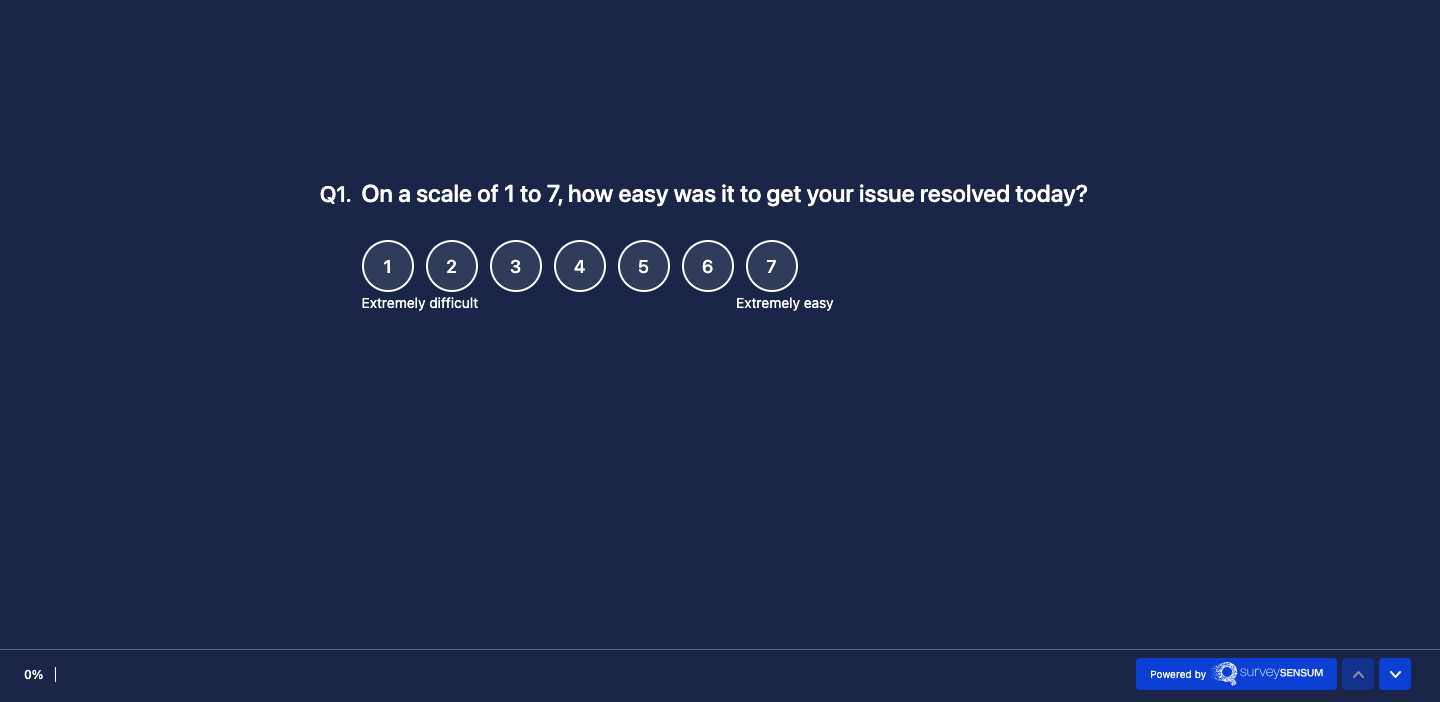
How to measure: CES (Customer Effort Score) surveys typically ask a straightforward question aimed at measuring the ease of a customer’s experience, such as, “On a scale of [1-7/1-5], how easy was it to resolve your issue today?“
The response options vary from “Very Difficult” to “Very Easy,” allowing customers to rate their experience based on the effort they put in to resolve an issue or complete a task.
CES = (Total sum of individual CES) ÷ (Number of customer responses)
For example, if you ask, “On a scale of 1 to 7, how easy was it to get your issue resolved today?”, you add up all the numbers and divide by the total number of questions to get one average score.
Launch CES Surveys with SurveySensum
Free Forever • No Feature Limitation • No Credit Card Required • Get a Live Demo ![]()
6. Retention Rate
Customer retention rate shows how many customers stick with your business over time. It tells you if customers are happy and want to stay.
Why to measure – Measuring the Retention Rate is crucial because it indicates the percentage of customers a business retains over a specific period. It helps gauge customer satisfaction, the effectiveness of services, and the business’s overall health.
How to measure: To find the customer retention rate, subtract the new customers you got during a period from the total customers you had at the start of that time. Then, divide this number by the total customers you had at the start of the period and multiply by 100 to get the retention rate percentage.
Retention Rate = (Number of Customers at End of Period – Number of New Customers Acquired During Period/ Number of Customers at Start of Period)x 100
7. Self-Service Metrics
92% of the customers hope companies will offer them a way to solve issues using self-service metrics. This kind of metrics gives them the power to fix problems quickly and easily.
But here’s the big question: Is your brand’s self-service system meeting your customers’ expectations?
The self-service metric helps you to see how well your self-service system is working. It shows you if there’s any content that could be more helpful if some articles could be doing better, or if there are any other problems. By monitoring these metrics, you can stop problems before they happen and ensure customers don’t get upset because the self-service isn’t working well.
Why to measure – Understanding self-service metrics allows businesses to evaluate how well customers navigate and utilize self-service tools, identify areas for improvement, and ensure the overall effectiveness of their self-service strategy.
How to measure – To figure out the percentage of requests from self-help tools like your FAQs, chatbots, or knowledge base, divide the number of self-help requests by the total number of tickets. Then, multiply that answer by 100 to get the percentage. Easy-peasy!
Self-Service Rate = (Total Number of Self-Service Interactions / Total Number of Customer Interactions) x 100
Bank of America’s Virtual Assistant, ERICA, uses smart technology to help customers with things like changing passwords or fixing mistakes on their accounts. It’s quick and doesn’t make customers wait in line to talk to a human. With ERICA’s help, managing bank accounts becomes easier.
Plus, because ERICA is guided by artificial intelligence (AI), it always gives the right information. So, using ERICA makes banking more accurate and convenient for customers.
8. Average Ticket Handling Time
The ticket handling time represents an agent’s duration to handle a single case. Efficiency improves as this duration decreases. However, focusing only on this metric may lead agents to prioritize speed over providing exceptional customer service.
SurveySensum, for instance, automatically generates tickets for customer feedback and assigns them to the right person. Plus, you can set deadlines for these tickets. This helps agents manage their time effectively and ensures timely resolution of customer issues.
Why to measure – Measuring Average Ticket Handling Time is crucial because it indicates the efficiency of dealing with customer queries or issues.
How to measure: The aim is to make sure your agents spend less time on each task, so they can do more. Use a system that keeps track of the time it takes for agents to handle each customer request, either by agents entering the time themselves or automatically. Look at the average time taken over a week and a month.
Average Ticket Handling Time = (Total time taken to handle tickets/Number of tickets handled)
You can also compare it to data from last year to see if there’s been a change over a long period.
9. Agent Performance Metrics
Agent Productivity is a really important measure for call centers. It shows how much time agents spend on calls or doing work related to calls. Managers use this number to see if their team is working as effectively as they want them to.
Also, managers use this information to help agents work better or change how things are done based on what they find out.
Why to measure – Measuring agent performance metrics provides insights into how well agents are performing, identifies areas for improvement, and ensures a high standard of customer support.
How to Measure – To work it out, divide the total amount of work done by the total amount of work expected, and then multiply it by 100.
Agent performance metrics = (total amount of work done/total amount of work expected) x 100
10. First Contact Resolution Rate
70% of customers think companies should work together, so they don’t have to repeat information to different agents. It reflects that customers prefer having their problems fixed without having to communicate their issues to different agents.
First-call resolution (FCR) measures customer satisfaction by assessing how many issues are resolved during the first call. The greater the number of customers receiving a resolution on the first contact, the higher the likelihood they’ll stay loyal, trusting your ability to swiftly address their concerns.
It’s a useful metric to keep an eye on because a high first-contact resolution rate is likely linked to CES – customers won’t have to make extra efforts if they only need to contact your organization once.
Why to measure – Measuring the First Contact Resolution Rate is essential because it reflects customer service efficiency. It signifies how successful a company is in addressing customer issues or inquiries in a single interaction, showcasing its ability to provide swift and effective solutions without the need for follow-ups or escalations.
How to Measure – Find the first contact resolution rate by dividing the number of issues resolved in the first contact by the total number of issues.
First contact resolution rate = Number of customer inquiries resolved in one call / total number of resolved calls
Additionally, you can measure the average number of replies needed for a customer to resolve their issue and the time it takes from when the customer reports the problem to when it gets fixed.
Conclusion
In today’s competitive landscape, customer satisfaction and effective handling of negative feedback are critical elements shaping a brand’s success. Embracing customer service metrics and leveraging feedback not only enhances customer experiences but also fortifies brand loyalty.
To streamline this process and gain actionable insights from customer feedback, consider leveraging advanced tools like SurveySensum. It helps you gather, analyze, and use customer feedback to improve things making the process more streamlined. That way, you can keep customers happy and make them want to stick with your brand for a long time.
Launch Customer Satisfaction Survey with SurveySensum
Free Forever • No Feature Limitation • No Credit Card Required • Sign Up For Free ![]()