 XM Knowledge Base

Market Research
Qualtrics XM Institute launches new CX benchmarks
Do you want to find out how your industry ranks for customer experience (CX)? Or perhaps you want to know what the average CX rating is for companies like your own to help benchmark your own performance?
To help your business understand how it ranks in CX and identify steps you can take to take your offerings to the next level, Qualtrics XM Institute is excited to launch this year’s XMI Customer Ratings – Overall.
The ratings are a cross-industry, open-standard benchmark of customer experience. This year’s Ratings are a continuation of the Temkin Experience Ratings, which Temkin Group began publishing annually in 2010 and used by some of the world’s leading companies.
Standout findings
Contact your account representative to access the full report. But to whet your appetite here’s insight into some of the headline findings from XMI Customer Ratings – Overall.
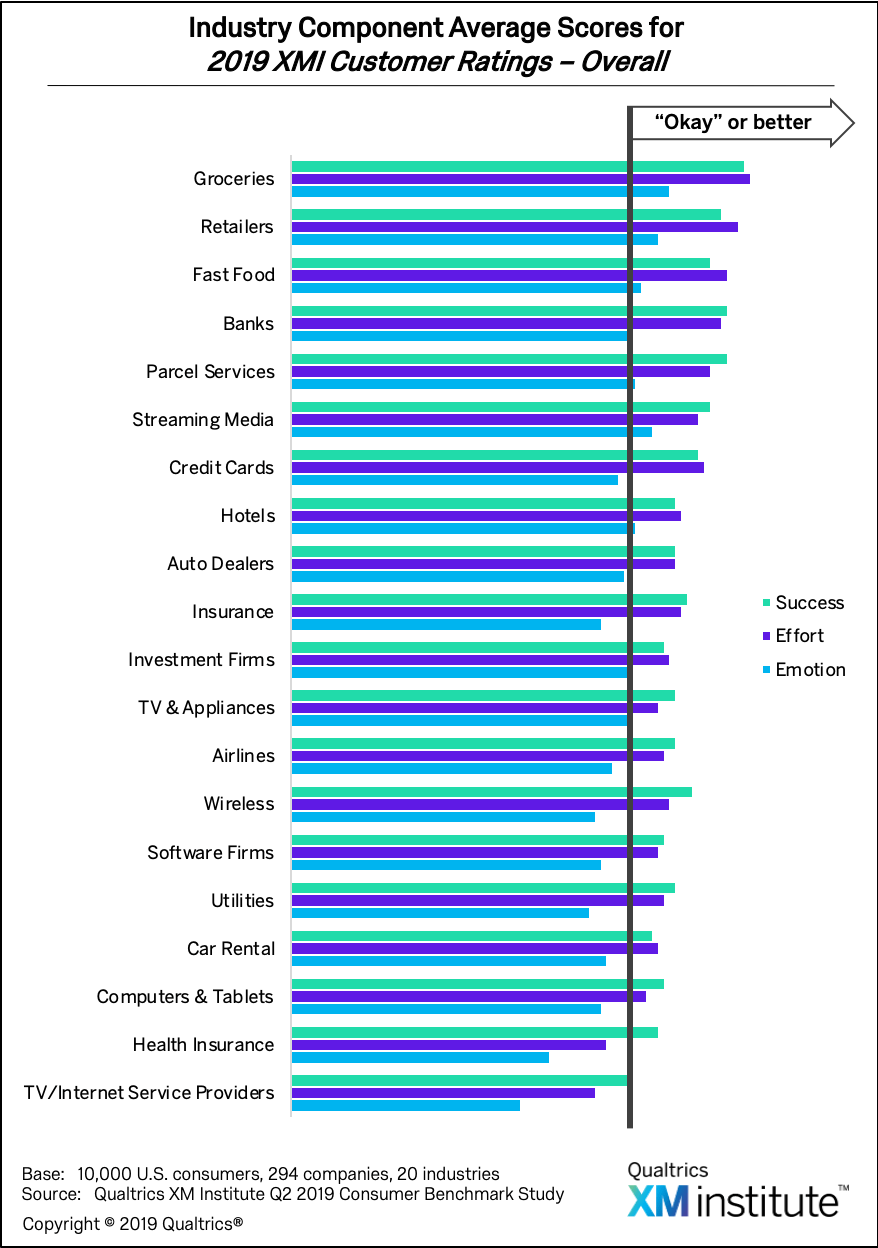
- Overall quality of CX: Overall, only 2% of companies earned an “excellent” rating, while 25% of companies were rated as either “poor” or “very poor.” The highest concentration of “good” or “excellent” companies is in groceries, where 18 out of 22 companies earned those high ratings. At the other end of the spectrum, six industries - Car Rental, Health Insurance, Software Firms, TV & Appliances, TV/Internet Service Providers, and Wireless - had no companies earn “good” or “excellent” ratings.
- Overall ratings: The overall ratings range from a high of 84% in Groceries down to a low of 23% in Fast Food. On average, Groceries earned the highest ratings (75%), while TV/Internet Service Providers received the lowest (51%).
- Success ratings: The Success element earned the strongest scores, with an average rating of 69% across industries. Success ratings range from a high of 87% in Groceries down to a low of 17% in Fast Food. On average, groceries earned the highest Success ratings (75%), while TV/Internet Service Providers received the lowest (51%).
- Effort ratings: The Effort ratings range from a high of 87% in Groceries down to a low of 28% in Fast Food. On average, Groceries earned the highest Effort ratings (80%), while TV/Internet Service Providers received the lowest (53%).
- Emotion ratings: The Emotion element is the weakest component, with an average score of 56% across all industries. Emotion ratings range from a high of 79% in Groceries down to a low of 23% in Fast Food. On average, Groceries earned the highest Emotion ratings (66%), while TV/Internet Service Providers received the lowest (40%).
How to use the ratings
As I’ve written about in the past, companies shouldn’t overly focus on these types of external benchmarks. While organizations can use this data to understand the state of CX within their industry, they need to rely more on their own data to drive continuous improvements.
One of the indisputable findings of this benchmark is that companies across all industries have a long way to go on their CX journeys. This finding is mirrored in our recent research report, The State of Customer Experience Management, 2019, which found only 6% of large companies have reached the top two levels of CX maturity.
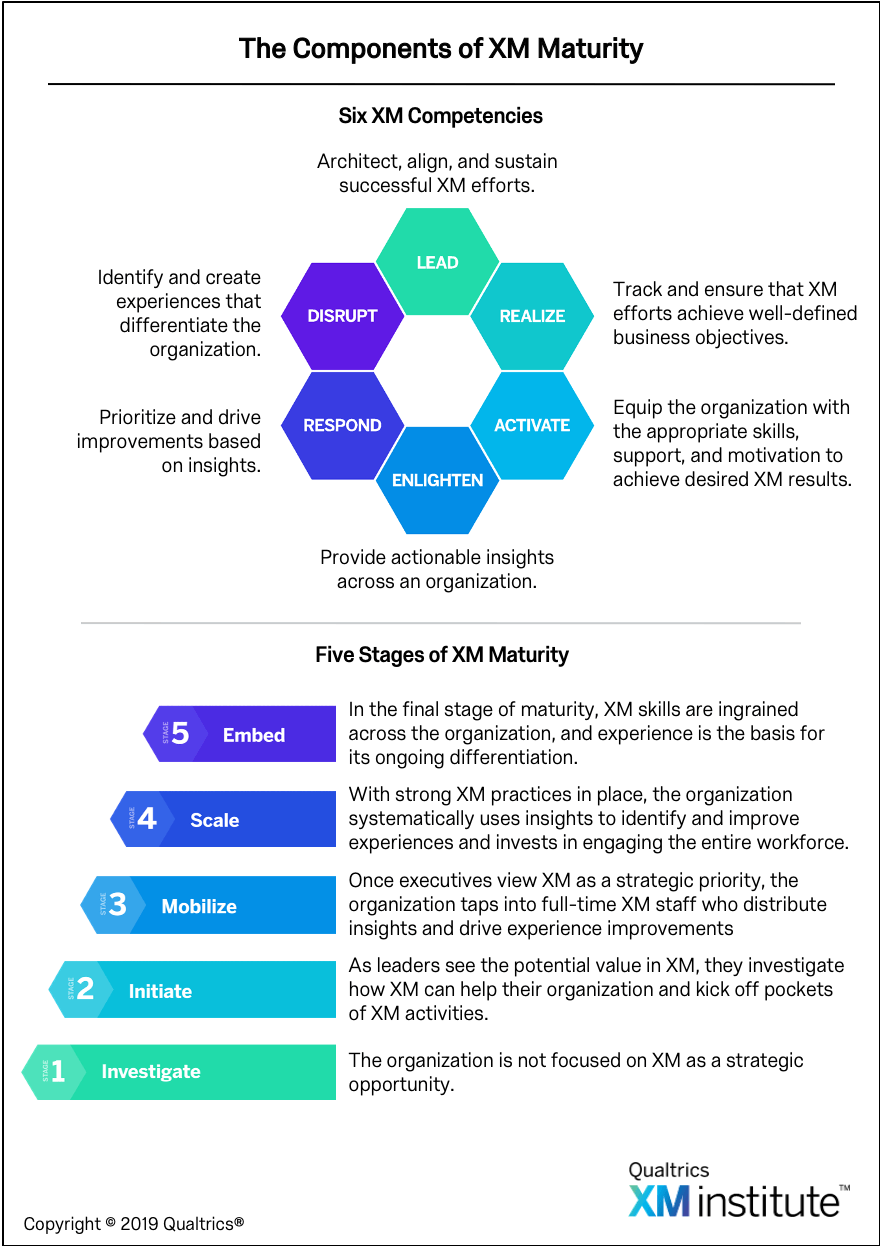
The State of Customer Experience Management, 2019 includes a maturity assessment to help you understand how your business ranks, and defines the Six XM Competencies.
- LEAD: Architect, align, and sustain successful XM efforts.
- REALIZE: Track and ensure that XM efforts achieve well-defined business objectives.
- ACTIVATE: Equip the organization with the appropriate skills, support, and motivation to achieve desired XM results.
- ENLIGHTEN: Provide actionable insights across an organization.
- RESPOND: Prioritize and drive improvements based on insights.
- DISRUPT: Identify and create experiences that differentiate the organization.
How we calculated the ratings
To generate the Ratings, Qualtrics XMI asked 10,000 U.S. consumers to rate their recent interactions with 294 companies across 20 different industries, and then evaluated their experiences across three components: success, effort, and emotion. The score for each company was calculated in the following way:
- For each of the three separate components, we look at the percentage of consumers who gave the company a high score (“6” or “7”) on our set of 7-point scales) and the percentage who gave the company a low score (“1,” “2,” or “3”).
- Within each individual component, we subtract the percentage of low scores from the percentage of high scores. This results in three separate ratings.
- Finally, we average these three component scores (success, effort, and emotion) for each company to generate that firm’s XMI Customer Rating - Overall Score.
The Ratings represent one of many options you can use to measure your organization’s CX. Whatever measurements you use, make sure that they’re helping you to consistently surface your customers’ needs and desires, understand their perception of your relationship, and deliver experiences that exceed their expectations.