Decoding customer satisfaction with hourly, daily, weekly, and monthly trends
The invaluable pattern widgets and performance reports offer a comprehensive view of performance patterns across various timeframes – hourly, daily, weekly, and monthly. These widgets transform data into a visual “heat map” grid, allowing you to pinpoint peaks and troughs in satisfaction levels based on both the satisfaction index and the number of responses collected.
What are HappyOrNot time patterns?
This tool goes beyond the surface, allowing you to decode timely trends in customer feedback.
The visually intuitive grid elegantly displays feedback distribution, highlighting the best and worst performing times based on the satisfaction index and the volume of responses collected. Following the same robust analytical method as the ranking widget, these tools unveil recurring events that either elevate or challenge your results.
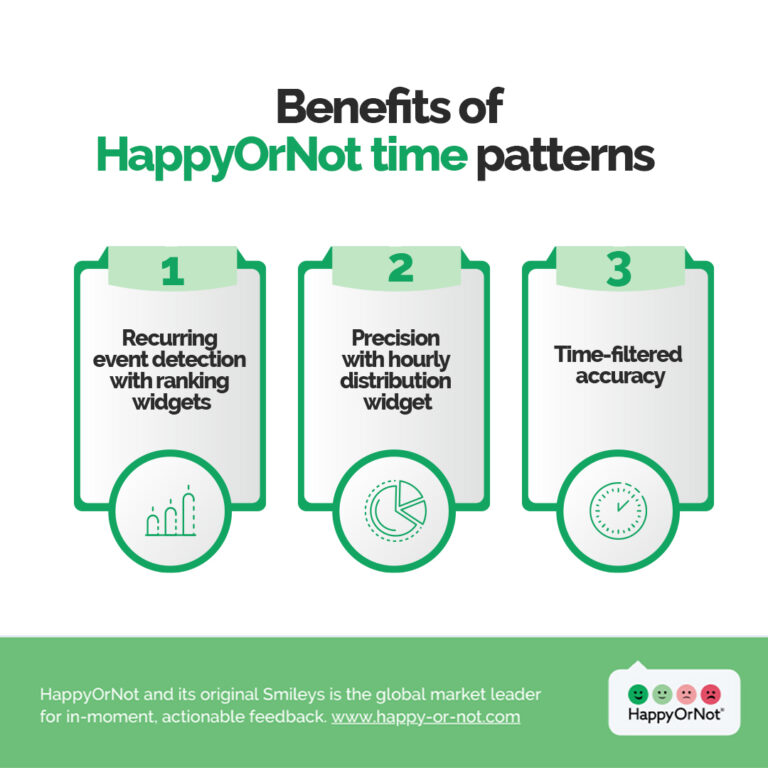
3 Benefits of HappyOrNot time patterns
HappyOrNot’s solution provides an intricate understanding of the ebb and flow of customer sentiment, introducing a paradigm shift in how businesses approach performance analysis.
- Recurring event detection with ranking widgets
By applying the same robust analysis method as the Ranking widget, these tools unveil recurring events on specific weekdays or times of the day that significantly impact your results. Whether it’s a surge in satisfaction after a weekend promotion or a dip on Monday mornings, these widgets make the invisible visible.
- Precision with hourly distribution widget
Zooming in on the nitty-gritty details, the Hourly Distribution Widget on the Details page is a precision tool. It consolidates results for specific hours across all days, offering a comprehensive view of performance.
Imagine having 15 positive responses at 11:00 AM spread over three days. This widget helps you discern the average performance of each hour, empowering you to allocate improvement efforts where they matter most strategically.
- Time-filtered accuracy
Context matters, and HappyOrNot understands that. The widgets adapt dynamically based on your chosen time filters, ensuring the insights provided align with your reporting needs. Whether you’re assessing the past week or delving into the last month’s trends, HappyOrNot’s time patterns seamlessly adjust to offer you the most relevant and actionable information.
HappyOrNot time patterns unveiled for specific industries
The HappyOrNot time patterns emerge as particularly indispensable for certain types of businesses. Here’s a tailored breakdown of who stands to gain the most from these insightful widgets.
Retailers and shopping centers
HappyOrNot’s time patterns give retailers a precise tool to analyze customer satisfaction trends. This tool helps retailers optimize staffing levels during peak hours and create targeted marketing strategies that hit the mark when it matters the most.
Restaurants and cafés
Restaurant owners can use these patterns to identify the high and low satisfaction periods and adjust their staff schedules and operational routines accordingly. This ensures that customers leave with not only satisfied taste buds but also content hearts.
Healthcare
The HappyOrNot time patterns provide valuable insights for hospital administrators and clinic managers, allowing them to navigate hourly, daily, and weekly trends. That way, you can guarantee that the quality of care aligns seamlessly with the ebb and flow of patient experiences.
Travel services
The travel industry operates around the clock, and understanding customer satisfaction trends is key to a smooth journey. Airlines, train services, and travel agencies can utilize the HappyOrNot time patterns to align their services with peak satisfaction periods, creating a seamless travel experience for passengers.
Education
Even in education, focusing on knowledge transfer, student satisfaction is paramount. HappyOrNot time patterns empower educational institutions to identify peak study hours, adjust resource allocation, and enhance student support services, ensuring a positive learning environment.
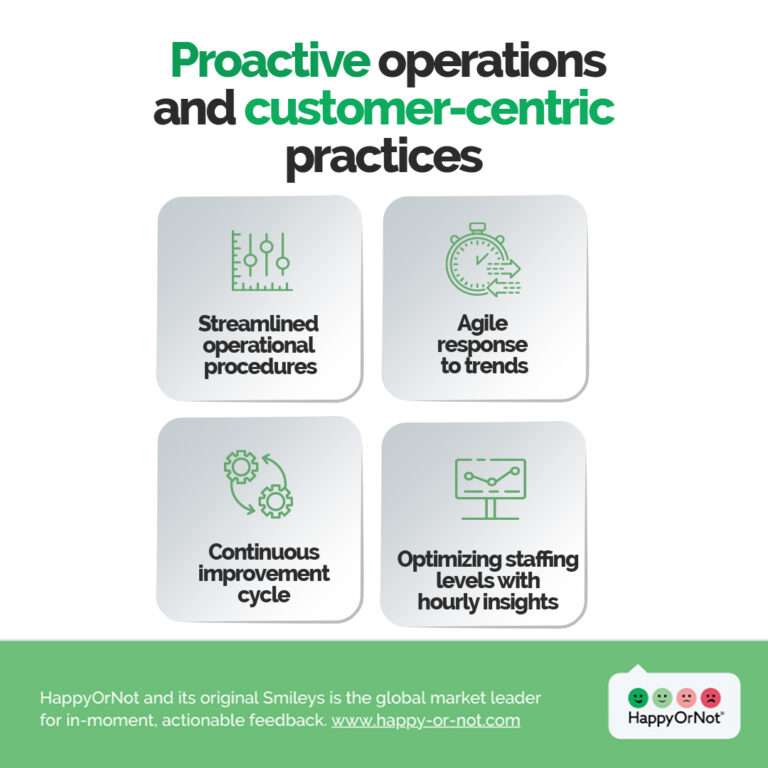
Proactive operations and customer-centric practices
Companies can leverage the insights from time patterns to tackle challenges proactively and lay a robust foundation for customer-centric practices that ultimately enhance the overall customer experience.
- Streamlined operational procedures
Whether adjusting workflows during peak hours or optimizing service processes during slower times, aligning operating systems with customer satisfaction trends increases efficiency and creates a more responsive business operation.
- Agile response to trends
Adapting operational strategies in real-time based on shifting satisfaction patterns ensures that businesses remain agile in changing customer preferences, contributing to sustained operational efficiency.
- Continuous improvement cycle
Businesses can use the data to identify areas for refinement, implement changes, and monitor the impact on customer satisfaction. This cyclical process ensures operational efficiency remains an ongoing priority, leading to sustained success in meeting customer expectations.
- Optimizing staffing levels with hourly insights
By analyzing the hourly distribution, the business identifies a pattern of increased customer traffic and dissatisfaction between 2:00 PM and 4:00 PM. With this knowledge, the management can adjust staffing levels during these hours, ensuring enough employees are available to meet customer needs promptly.
Practical examples of the HappyOrNot time patterns: Dublin Airport’s Robust Data System
Dublin Airport elevates customer experience by seamlessly integrating HappyOrNot data into its robust Business Intelligence platform. This integration provides a comprehensive view of passenger responses, allowing the airport to gauge the efficiency of processes and the emotional sentiment of travelers.
The scores are a key component of the monthly operations report sent to the Chief Executive, highlighting areas of improvement and outlining action plans. The airport utilizes this data internally and ensures third-party suppliers maintain high-quality service performance.
With years of data at its disposal, Dublin Airport monitors changes in passenger happiness year on year, fostering a continuous commitment to excellence.
Conclusion
Businesses must understand and meet customer expectations. By providing user-friendly interfaces and ensuring anonymity, the system encourages customer participation, facilitating a continuous feedback loop. This feedback loop forms the foundation for informed decision-making, leading to sustained success.
FAQ
In what ways does HappyOrNot encourage customer participation and response collection to ensure the accuracy of the time patterns?
HappyOrNot encourages accurate time patterns through an intuitive user interface, quick surveys, timely prompts, and possibly incentives for participation. The platform may also employ various channels for feedback submission, fostering accessibility.
How does HappyOrNot make it easy for customers to give feedback?
The feedback is simplified with its user-friendly smiley-face terminals, allowing customers to express satisfaction or dissatisfaction intuitively and quickly.
Does HappyOrNot remind customers to share their opinions?
Yes, HappyOrNot encourages continuous feedback by strategically placing terminals prompting customers to share their opinions effortlessly.
Can customers give feedback anonymously?
Yes, HappyOrNot respects privacy, and the feedback is always anonymous by default ensuring honest opinions without fear of repercussion.
What are the available options for customers to share their feedback?
HappyOrNot offers versatility, allowing customers to share thoughts through smiley-face terminals, online surveys, or other convenient methods, catering to diverse preferences in expressing feedback.