What is HappyOrNot’s customer feedback location comparison?
Understanding and optimizing customer satisfaction are key in the fast-paced, customer-centric business world. HappyOrNot, with its innovative tools, provides companies with insightful data to enhance the customer experience.
In this article, we’ll discuss 2 powerful instruments in the HappyOrNot arsenal: the Comparison Widget and the Ranking Widget, which equip businesses and managers to dissect, analyze, and elevate customer satisfaction.
What is location comparison for customer feedback?
Location comparison involves analyzing customer feedback data from different physical locations or digital touchpoints within a business. Whether it’s retail stores, service centers, online store, or any other point of interaction, this approach allows companies to identify trends, patterns, and areas for improvement on a granular level.
HappyOrNot, with its distinctive Smiley face feedback terminals, provides a simple and effective way for customers to express their satisfaction. The aggregated data collected from these terminals can be dissected and compared across various locations, shedding light on the nuances of customer experiences in different settings.
What is the comparison widget and how does it work?
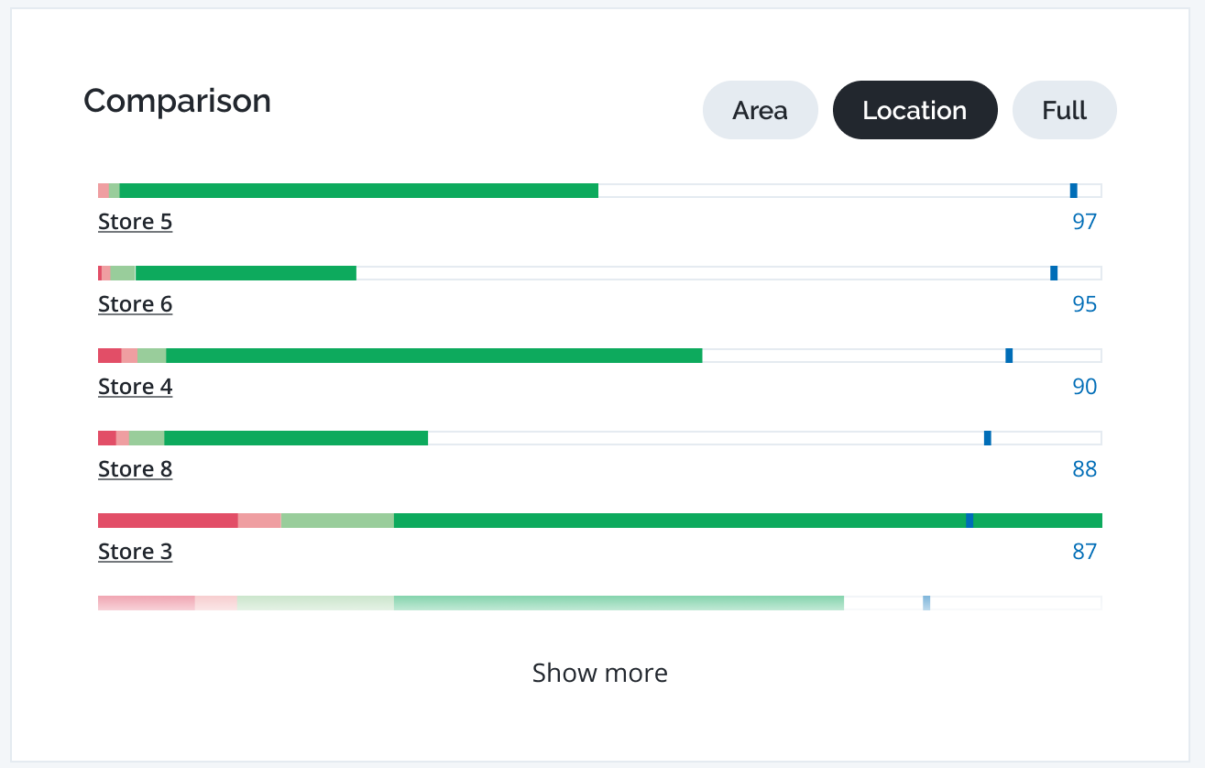
At the heart of HappyOrNot’s analytical prowess lies the Comparison Widget, a powerful tool designed to illuminate the performance of different groups and experience points within your business. Here are some of its key features:
Visualizing performance
The Comparison Widget visually represents the results of groups and experience points under the selected group. This intuitive display allows you to effortlessly compare the performance of different groups and experience points, giving you a comprehensive view of your business.
Group-level insights
The widget provides its wisdom only when viewing feedback data on a group level. This ensures a focused analysis, allowing you to zoom in on specific aspects of your business.
Performance index ranking
Groups and experience points are meticulously arranged within the widget based on their performance index. This ranking system aids in quick and informed decision-making, highlighting the areas that demand your attention first.
Viewing options
The Comparison Widget offers 3 viewing options to cater to your analytical preferences:
- AREA: Displays only the groups and experience points directly under the chosen group. This focused view allows for a detailed examination of specific areas within your business.
- EXPERIENCE POINT: Reveals all experience points under the chosen group. This comprehensive view enables a deep dive into the individual touchpoints contributing to the overall customer experience.
- FULL: Unleashes the full spectrum of data, showcasing all groups and experience points under the chosen group. This panoramic view is ideal for businesses seeking a holistic understanding of their customer feedback
What is the ranking widget and how does it work?
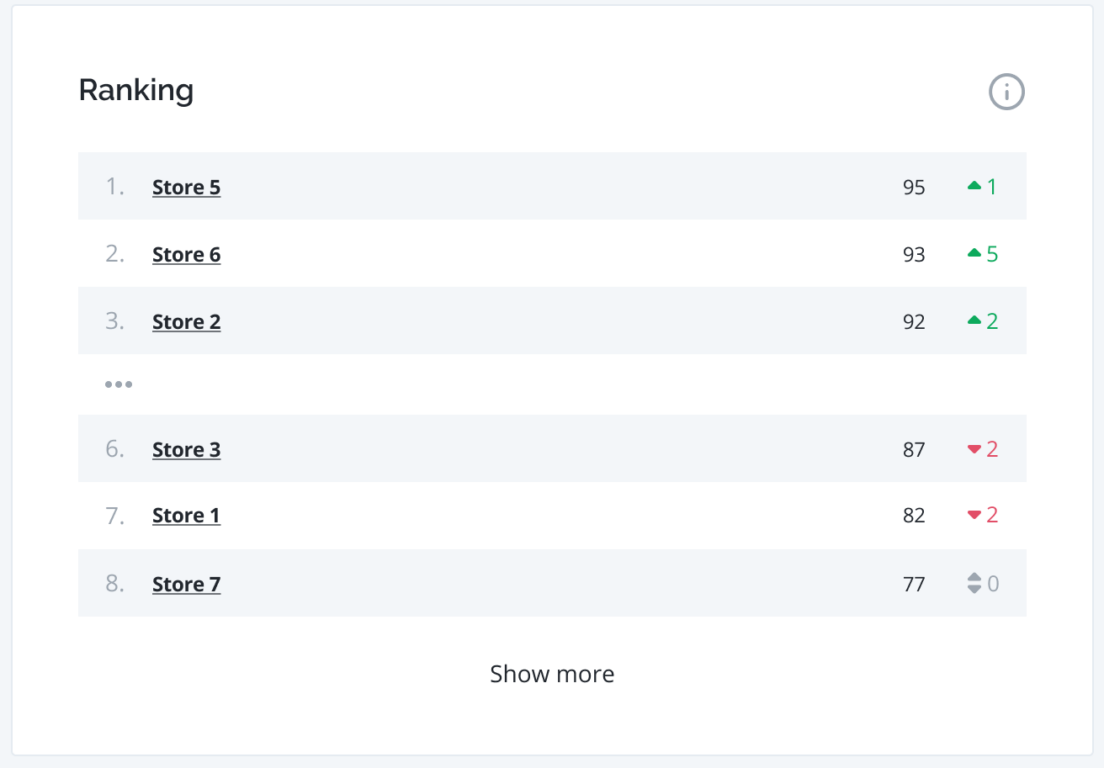 The Ranking Widget offers a panoramic view of the performance spectrum across different locations. For Area Managers, this widget guides through the top-performing areas and those that might require a touch of attention.
Elevating insights for Area Managers
The Ranking Widget provides a clear map of your top and bottom locations. This not only expedites identifying areas needing improvement but also highlights shining examples that can serve as examples for developing customer satisfaction strategies.
The display
The list within the widget showcases both the top and bottom of performance, presenting the names of the top and bottom-performing locations. Alongside these names, you’ll find the absolute score, and their corresponding changes compared to the previous period for the selected timeframe.
The option to “SHOW MORE” unveils the comprehensive ranking of all locations, providing a granular understanding of the customer satisfaction landscape.
The Ranking Formula
This formula considers a location’s score, the number of responses collected, and the average score and responses across all locations during the specified period. The result is a numerical value known as the Ranking Score.
The Ranking Score is calculated for each location, ensuring that a location with a limited number of responses is not overlooked. On the flip side, a location with a wealth of responses sees its ranking shaped more significantly by its absolute Ranking Score.
The formula inherently grants more credibility to the Index derived from a substantial volume of responses, creating a system where trust is proportional to the reliability of the data.
Conclusion
The Comparison Widget guides businesses through the nuances of customer feedback. Whether focusing on specific groups, individual experience points, or the entirety of the landscape, this tool provides a dynamic lens to understand and improve customer experiences.
The Ranking Widget, on the other hand, is the strategic map for Area Managers. It goes beyond mere ranking, offering a nuanced formula that not only considers scores but also weighs the trustworthiness of the data. Each location’s story is told through the Ranking Score, a testament to the meticulous calibration of trust in the pursuit of customer satisfaction excellence.
FAQs
How often should I use the Comparison Widget?
Utilize it regularly to spot trends. Frequent checks empower you to adapt swiftly, ensuring continuous improvement in customer satisfaction across diverse touchpoints.
Can the Ranking Widget help me understand the impact of changes over time?
Absolutely! It ranks locations and highlights changes, providing a dynamic view of your customer satisfaction landscape’s evolution.
How does the Comparison Widget handle varying response volumes across locations?
It intelligently factors in response volumes, ensuring fairness. The ranking is influenced by the location’s performance and the overall average across all locations.
What’s the significance of the “Show More” option in the Ranking Widget?
“Show More” unveils a comprehensive ranking of all locations, giving you a deeper dive into the nuanced performance of each area within your business.
How can the Comparison Widget benefit my decision-making process as a business owner?
By offering a visual representation of performance data, the widget aids in strategic decision-making, providing valuable insights for enhancing overall customer satisfaction across locations.