


How well is your SaaS product performing, especially in terms of SaaS customer retention? Are you successfully achieving the goals you set for the previous year, or do you find yourself lagging behind?
To answer these questions it is important to assess your performance and ensure that you are headed in the right direction. And to do that you need to use a SaaS feedback platform that can set and track your SaaS KPIs the right way.
But the challenge is that the SaaS industry is a thriving one with new products emerging every day. And with that, the customer’s expectations and needs are also evolving. So, tracking irrelevant and outdated KPIs for SaaS products can result in a setback in your success journey.
With that in mind, after working with different companies in this industry, we have compiled a list of 13 key SaaS KPIs and metrics of 2023 that you need to start tracking to measure your success. Let’s begin!
How to Measure the Performance of a SaaS Company?
13 Important SaaS KPIs You Should Track In 2023
- Net Promoter Score
- Net Retention Rate
- Product Signups
- MQL to PQL Ratio
- QLVR (Qualified Lead Velocity Rate)
- ROAS and ROI (Organic and Paid)
- Customer Acquisition Cost
- Customer Health Score
- North Star Metric for Product
- Customer Lifetime Value
- DAU/MAU (Daily/Monthly Average Users)
- MRR, ARR, CMRR
- Average First Response Time and Average Resolution Time
Now, let’s begin with how you can measure the performance of your SaaS company.
How to Measure the Performance of a SaaS Company?
Statista predicts that in 2023, the SaaS market is estimated to be worth approximately $197 billion and estimated to reach $232 billion by 2024.
This staggering number reflects the vast potential of the SaaS industry and the opportunities it offers to companies.
However, to succeed in this industry, you must know how to measure your performance. After all, how else can you track your growth? But how to do that?
— With SaaS KPIs
What are SaaS KPIs?
SaaS KPIs are metrics and data points that SaaS businesses use to assess the performance and health of their business. These SaaS KPIs are crucial for measuring various aspects of a SaaS company’s operations, growth, and overall success.
In traditional business, success is often measured by the number of products sold, and the emphasis is on acquiring as many customers as possible with a one-time sale. In contrast, SaaS companies rely on recurring revenue from subscriptions, which sets a different set of KPIs and metrics for success.
This is why SaaS businesses must focus heavily on retaining customers and ensuring that they keep using their products and services. So, the main SaaS KPIs that companies focus on are customer retention, customer acquisition cost, customer lifetime value, and monthly revenue.
But KPIs are not the only tool required to measure the performance of a SaaS company, there are SaaS metrics that are equally important, such as customer acquisition cost (CAC), churn rate, and utilization of the best invoicing software.
In other words, if KPIs are the ultimate destination then metrics are what is used to reach that destination.
So, what is the difference between the two? Let’s understand.
SaaS KPIs vs. SaaS Metrics
SaaS KPIs and SaaS Metrics are related concepts used to assess the performance of any SaaS business, but they serve slightly different purposes and have distinct characteristics.
Let’s understand this with an example.
Imagine you’re the marketing manager for a SaaS company, and you’re launching a new website to promote your product. You started tracking website traffic to gauge the effectiveness of your marketing efforts. Here, your website traffic is your SaaS metric.
But as a SaaS company, your primary goal is to convert these website visitors into paying customers. This can be done by measuring the conversion rate. Now, this is your SaaS KPI.
While both website traffic and conversion rate are essential for a SaaS business, website traffic is a metric because it provides a specific, measurable value for a single point in time, whereas the conversion rate is a KPI because it helps you evaluate your ultimate goal – the performance of your website.
To put it simply, metrics tell you what’s happening, while SaaS KPIs tell you if you’re succeeding in achieving your goals based on what the metrics are showing.
KPIs are result-driven while metrics are data-driven.
Both are important for managing and growing a SaaS business, but KPIs are the metrics that demand your closest attention because they directly tie to your overall success.
Now, that you understand what are SaaS KPIs and the difference between SaaS KPIs and SaaS metrics, let’s delve into what SaaS KPIs you should track. But before that let’s quickly understand the four important categories of SaaS KPIs.
4 SaaS KPI Categories
Your SaaS KPIs should cover these four main areas – sales & marketing, revenue, product usage, and customer experience. Even if you choose to monitor just a handful of KPIs, it’s essential to include these key areas as benchmarks to measure your overall business performance.
1. Sale & Marketing
This category encompasses KPIs that evaluate the effectiveness of your customer acquisition efforts, from lead generation to conversion. These are the important metrics that you need to track in this category:
- Customer Acquisition Cost: CAC measures how much it costs to acquire a new customer. A low CAC relative to customer lifetime value indicates efficient customer acquisition.
- Conversion Rate: Conversion rate metrics evaluate the effectiveness of your sales and marketing efforts at different stages of the customer journey.
- Lead-to-Customer Ratio: This metric compares the number of leads generated to the number of leads that ultimately convert into paying customers.
2. Revenue
These KPIs focus on the financial aspects of your SaaS business, helping you assess its growth and sustainability. These are the important metrics that come under this category:
- Monthly Recurring Revenue: MRR quantifies your predictable monthly revenue from subscription-based customers, providing insights into revenue growth trends. Utilizing invoicing software is an effective method to monitor your Recurring Revenue.
- Annual Recurring Revenue: ARR is the yearly equivalent of MRR and offers a more extended view of revenue. It’s valuable for long-term financial planning and forecasting.
- Gross Margin: Gross margin measures the profitability of your SaaS product by subtracting the direct costs associated with delivering your service from your revenue.
- Customer Lifetime Value: CLTV estimates the total revenue a customer is expected to generate over their entire relationship with your company.
3. Product Usage
In this category, you measure how well your customers are engaging with and utilizing your SaaS product. KPIs in this category include:
- Feature Adoption Rate: This metric tracks how frequently users engage with specific features of your SaaS product.
- User Retention Rate: User retention KPIs measure the percentage of users who continue to use your product over time.
- Churn Rate: The churn rate calculates the percentage of customers who cancel their subscriptions within a given period.
4. Customer Experience
This category is all about understanding your customers’ feelings and experiences with your product. Key metrics include:
- Net Promoter Score: NPS gauges customer loyalty by asking how likely customers are to recommend your product to others.
- Customer Satisfaction: CSAT measures the satisfaction level of customers based on their interactions with your product or support services.
- Customer Support Response Time: This KPI evaluates how quickly your support team responds to customer inquiries or resolves issues.
These four KPI categories serve as pillars for evaluating different aspects of your SaaS business. Through consistent monitoring and thorough analysis of these KPIs, you can gain valuable insights to guide your decision-making, enhance operational efficiency, and drive growth and customer satisfaction in a highly competitive market.
Now that we have the important KPIs categories and metrics of a SaaS business, let’s understand the 13 important SaaS KPIs that you should track.
13 Important SaaS KPIs You Should Track In 2023
1. Net Promoter Score
NPS measures the overall satisfaction and loyalty of your customers by asking them a simple question – “On a scale of 0 to 10, how likely are you to recommend our product/service to a friend/colleague?“
But why measure it?
NPS helps you gauge customer satisfaction and loyalty. Higher NPS scores indicate that more customers are likely to promote your product, which can lead to increased customer acquisition through word-of-mouth recommendations. It also helps identify areas where you can improve to turn detractors into promoters.
Here’s how you can calculate NPS:

2. Net Retention Rate
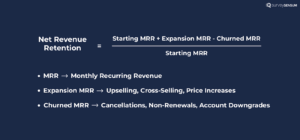
The Net Retention Rate measures the ability of a SaaS company to retain and grow revenue from existing customers, excluding the impact of new customer acquisition. It reflects how effectively a company is upselling, cross-selling, and preventing churn among its current customer base.
But why measure it?
Net Retention Rate is crucial because it represents the core revenue growth engine for a SaaS business. A rate greater than 100% indicates that your company is growing from existing customers, which is often more cost-effective than acquiring new customers. It also highlights the health of your customer relationships and the effectiveness of your upselling and cross-selling efforts.
To calculate your NRR, follow this formula:
3. Product Signups
Tracking product signups is an essential SaaS KPI, especially for those offering freemium or trial versions of their products. This metric monitors the number of users who sign up to use your SaaS product. It serves as a valuable indicator of the effectiveness of your product and marketing strategies in the public domain.
But why measure it?
Because it helps you determine how well your website, landing pages, and marketing campaigns are performing in terms of turning leads into active users. Furthermore, tracking signups can provide valuable insights into churn reduction. By understanding why some users sign up but don’t convert, you can identify pain points and areas for improvement.
4. MQL to PQL Ratio
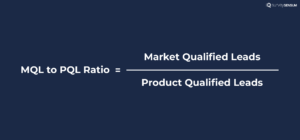
The MQL to PQL Ratio gauges how well your marketing generates potential paying customers.
MQLs are potential leads that marketing teams have identified as more likely to become customers. They often show interest in the product or service but may not be ready to make a purchase. Whereas, PQLs are leads that have demonstrated a higher level of interest and engagement with the product itself. And they are more likely to convert into paying customers.
But why measure it?
This ratio helps you assess the quality of leads generated by your marketing efforts. A low ratio may indicate that marketing efforts are attracting leads that aren’t a good fit for your product.
By improving the quality of leads (increasing PQLs), you can ensure that your sales team is spending their time on leads more likely to convert into paying customers, which can improve conversion rates and overall revenue.
Here’s how you can calculate the ratio:
5. Qualified Lead Velocity Rate
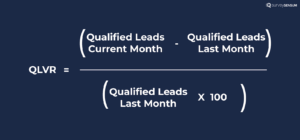
The QLVR measures the rate at which your sales and marketing teams are generating and converting qualified leads into customers. It provides insights into the growth potential of your customer base.
But why measure it?
Because it helps you understand the rate at which you are expanding your pool of potential customers and converting them into qualified leads. A high QLVR indicates healthy growth in your sales pipeline, which can lead to increased revenue. It also highlights the effectiveness of your lead generation and qualification processes.
To calculate QLVR:
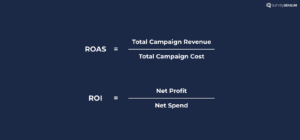
6. ROAS and ROI (Organic and Paid)
ROAS measures the effectiveness of your advertising campaigns by evaluating the revenue generated relative to the amount spent on advertising. Organic and Paid ROI assess the returns on investments made in both organic and paid marketing efforts.
But why measure it?
These metrics are critical for assessing the financial effectiveness of your marketing efforts, both paid and organic. Here’s why you should measure them:
- ROAS: Measuring ROAS is essential for evaluating the performance of your advertising efforts, such as PPC ads or online display ads. It helps answer the question of whether your advertising campaigns are delivering a positive return on the money invested. By analyzing ROAS, you can allocate your advertising budget more effectively, optimizing spending on campaigns that generate the most revenue.
- ROI (Organic & Paid): This metric helps you understand the return on investment for your organic and paid marketing efforts. It allows you to evaluate the profitability of your campaigns, optimize spending, and make informed decisions about whether to scale up or scale down specific marketing channels or campaigns.
To calculate ROAS and ROI, use the following formula:
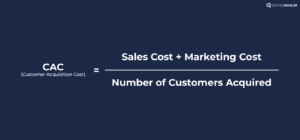
7. Customer Acquisition Cost
CAC calculates the cost associated with acquiring a new customer, including expenses related to marketing and sales efforts. It offers valuable insights into the expenditure incurred by your company for each new customer acquired. Ideally, the revenue generated from these customers should exceed the cost of acquiring them.
→ For example, you spent $20 to acquire a customer, and that customer spent $60 on your brand.
But why is it essential to measure CAC?
Because it helps you assess the efficiency and sustainability of your customer acquisition efforts. By tracking CAC, you can ensure that your customer acquisition costs are lower than the revenue generated from those customers.
It also guides decisions on budget allocation and the optimization of marketing and sales strategies.
Here’s the formula to calculate CAC:
8. Customer Health Score
Customer Health Score is a metric that assesses the overall health and satisfaction of your customer base. It considers various factors, including product usage, customer feedback, and engagement.
But why measure it?
Because measuring Customer Health Score helps you proactively identify at-risk customers and take measures to retain them. It can also uncover opportunities for upselling or cross-selling to healthy customers. By tracking customer health, you can reduce churn, improve customer satisfaction, and increase revenue from your existing customer base.
In order to analyze your customer health score, you need it calculate it. However, the calculation of customer health score can be customized based on your specific business and customer data. You assign scores to different customer interactions and behaviors, then sum them to arrive at an overall health score.
For example, if you want to assess the health of its customer relationships then you need to select the metrics such as Usage Activity, Customer Support Interactions, and Product Feedback and Satisfaction. Now, you need to assign scores to these metrics and then sum them.
9. North Star Metric for Product
The North Star Metric is a single, high-impact metric that serves as the primary indicator of your product’s value to customers. It reflects the core value proposition and the primary benefit customers receive from using your product.
But why measure it?
Because it is essential for aligning your product development efforts with customer needs and measuring the success of your product strategy. It ensures that everyone in the company understands the primary goal and value of the product.
The calculation depends on the specific metric chosen as the North Star Metric.
For example, if the North Star Metric is ‘Monthly Active Users,’ you would calculate it by counting the number of active users each month.
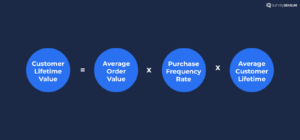
10. Customer Lifetime Value
Customer Lifetime Value represents the total revenue a customer is expected to generate for your company over the entire duration of their relationship with your business.
But why measure it?
CLV is critical for understanding the long-term value of a customer and making informed decisions about customer acquisition and retention strategies. It helps you determine how much you can invest in acquiring and retaining customers while ensuring that their lifetime value exceeds the cost of acquisition and servicing.
Here’s the formula to calculate CLV:
Improve Your SaaS CLV With SurveySesnum – Request a Demo
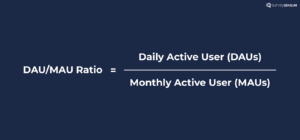
11. DAU/MAU (Daily/Monthly Average Users)
DAU/MAU measures the ratio of daily active users to monthly active users and indicates how frequently users engage with your product or platform.
DAU measures the number of unique users who interact with your product or platform on a daily basis. These users are actively engaging with your offering within a 24-hour period.
MAU, on the other hand, measures unique users who interact with your product or platform at least once during a calendar month.
But why measure DAU/MAU?
Measuring DAU/MAU helps you understand how often users are returning to your product, which is crucial for assessing product stickiness and overall user satisfaction. High DAU/MAU ratios indicate strong user engagement and retention.
Here’s, how you can calculate the DAU/MAU ratio:
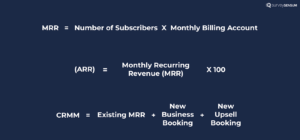
12. MRR, ARR, CMRR
MRR: represents the total monthly revenue generated from subscription-based customers.
ARR: ARR is similar to MRR but represents the total annual revenue generated from subscription-based customers.
CMRR: CMRR represents the portion of MRR that comes from contracted, committed, or guaranteed revenue.
Why should you measure them?
These metrics are fundamental for understanding your SaaS company’s recurring revenue streams.
MRR and ARR provide insight into your revenue stability, growth, and overall financial health. CMRR specifically helps identify contracted revenue, which is often considered more predictable and less prone to churn, providing a clearer picture of your future revenue outlook.
Here are the formulas to calculate your MRR, ARR, and CMRR:
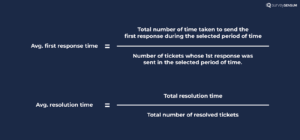
13. Average First Response Time and Average Resolution Time
The average first response time metric measures the average time it takes for your customer support or service team to respond to a customer’s initial inquiry or request. Whereas, the average resolution time metric measures the average time it takes to fully resolve a customer’s inquiry or issue.
But why measure them?
These metrics are crucial for evaluating the efficiency and effectiveness of your customer support or service operations. A shorter first response time and resolution time indicate better customer service, which can lead to higher customer satisfaction and retention.
Additionally, monitoring these metrics helps you identify bottlenecks in your support process and make improvements accordingly.
Calculate your average first response and average resolution time with this formula:
Now, that we know all the 13 important SaaS KPIs, let’s also understand the challenges that come with SaaS KPIs.
The Challenge With KPIs
The problem with KPIs is that there are too many to choose from. For businesses new to using KPIs, there may be a temptation to track every possible one, assuming that more data is better. However, this approach is problematic for several reasons.
- Attempting to track all available metrics can be overwhelming and time-consuming. It can lead to information overload, making it difficult to anticipate which data points are meaningful and relevant.
- Tracking numerous KPIs can be counterproductive because not all KPIs will provide actionable insights or contribute to your specific goals and objectives. Many of these KPIs may not directly impact your business’s success or may be redundant.
So, to this challenge, prioritize and focus on a concise set of KPIs that are closely tied to your specific business goals and capable of providing actionable insights. This approach will enable you to use KPIs more effectively for monitoring and improving your performance.
So, now, let’s understand which SaaS KPI is best for your business.
How to Choose the Right KPIs for Your SaaS Company?
Now, this is one of the crucial parts of your SaaS KPI journey, and the most important question marketers ask themselves – how to choose the right SaaS KPIs for your business?
Choosing the right KPIs for your SaaS company is an important step in monitoring and optimizing your business’s performance because if you don’t define your KPIs and metrics then how will you monitor your performance and growth?
So, here are the 5 stages in choosing the right KPIs for your SaaS business:
1. PURPOSE
-
STEP 1: Define Your Business Objectives
Start your journey by understanding your company’s overall goals and objectives. Answer the question – ‘What are you trying to achieve with your SaaS product?’ By clearly defining your specific goals and objectives, you provide a roadmap for your KPI selection process. Each of these objectives will require a different set of KPIs to measure progress effectively.
For example, to track revenue growth, you might focus on MRR, while for churn reduction, you’ll want to monitor metrics like customer churn rate and customer retention rate.
Tailoring your KPIs to your objectives ensures that you’re measuring what matters most for your SaaS company’s success.
2. STRATEGY
-
STEP 2: Identify Key Metrics
The next step is to identify the specific metrics that closely align with those objectives. This involves considering both leading and lagging indicators.
Leading indicators are metrics that provide early signals or predictive insights into future success. Whereas, lagging indicators are metrics that measure past performance and outcomes.
The key is to select a mix of leading and lagging indicators that provide a well-rounded view of your progress toward your objectives. By doing so, you gain the ability to take both proactive and corrective actions as needed.
-
STEP 3: Set Specific Targets
Now, after defining your KPIs, it is time to define clear and measurable targets for each selected KPI. These targets should be realistic and aligned with your business objectives. Setting targets provides a benchmark for success and helps track progress.
For example, if your churn rate is currently 10%, you might set a target to reduce it to 5% within the next six months.
3. PLANNING
-
STEP 4: Prioritize KPIs
Now that you have defined your KPIs, it is time to prioritize your KPIs because NOT all KPIs are equally important. Prioritize the KPIs that have the most significant impact on your objectives and business strategy. By doing so you can focus your efforts and resources where they are most likely to drive meaningful results.
For example, if churn rate is a significant issue, prioritize it as a key KPI because reducing churn can directly impact your MRR growth.
4. OPERATIONS
-
STEP 5: Take Action
Defining and prioritizing your KPIs is only valuable if you take action on it. To derive real value from KPIs, it’s crucial to take decisive action when they indicate a problem or an opportunity. This proactive and data-driven approach can lead to improved performance and increased efficiency.
For example, if your churn rate is higher than the target, analyze the reasons behind it, and implement retention strategies like onboarding improvements or customer support enhancements.
-
STEP 6: Monitor KPIs Regularly
But taking action isn’t enough – you need to MONITOR your KPIs regularly. Implement a robust tracking and reporting system to monitor your chosen KPIs regularly. Ensure that data is accurate, up-to-date, and easily accessible to relevant team members.
5. MANAGEMENT
-
STEP 7: Adapt and Iterate
KPIs are not set in stone. As your business evolves, so should your KPIs. Regular reviews and adjustments of your KPIs are essential for keeping your measurement strategies aligned with your objectives, market dynamics, and customer feedback.
For example, if your initial goal was to increase MRR, but you notice that customer satisfaction is declining, you may need to adjust your KPIs to include customer satisfaction metrics.
-
STEP 8: Evaluate the Impact
Lastly, continuously assess whether achieving your KPI targets leads to the desired business outcomes. Make adjustments as necessary to stay on track toward your objectives.
For example, if you successfully reduce churn and see an increase in MRR, evaluate whether this translates into improved overall revenue and profitability.
By following these five golden rules you can choose the right KPIs for your SaaS that align with your business goals and objectives.
Conclusion
Measuring your KPIs is the most important step in assessing your SaaS business performance and growth. However, many businesses encounter a common challenge – the selection of KPIs that align seamlessly with their business objectives. This often leads to a significant waste of time and effort without yielding desired results.
In this blog, we’ve highlighted 13 essential SaaS KPIs. By leveraging these carefully chosen metrics, you can streamline the process of selecting KPIs that not only resonate with your business goals but also empower you to accurately gauge and enhance your performance and growth.
To take your SaaS business growth a step further, use a powerful SaaS customer feedback platform like SurveySensum, in addition to knowing the 13 important SaaS KPIs. This tool will assist you in gathering valuable insights and data, enhancing your KPI selection and measurement process.
FAQs
Q. What are the leading indicators in SaaS?
A. Leading indicators in the SaaS industry are metrics that have the ability to forecast future performance, offering early insights into potential developments. They enable SaaS companies to adjust their strategies proactively, preventing issues from arising too late to address.
Some of the leading indicators in SaaS are
- MRR Growth Rate
- Customer Acquisition Rate
- Churn Rate
- Customer Lifetime Value
- Customer Engagement and Usage
- Sales Pipeline and Conversion Rates
- Net Promoter Score)
- Lead Generation and Conversion Rate
- Product Usage Metrics
- Market Trends and Competitive Analysis
Q. What is the rule of 40 in SaaS?
A. The Rule of 40 is a financial ratio that compares a SaaS company’s revenue growth rate to its profit margin. The rule states that a healthy SaaS company has a combined growth rate and profit margin of 40% or more.