


 4 Minutes


It’s that time of year again – back-to-school season! While children are probably excited to reunite with their friends and teachers, parents may feel differently. Back-to-school time can be a source of stress for many families due to all the preparation involved.
Back-to-School Spending Habits
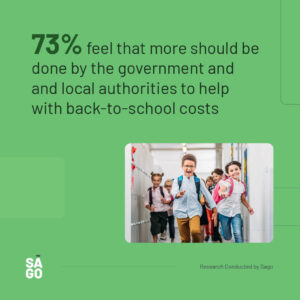
According to a recent survey conducted by Sago, out of 2,000 UK respondents, 847 parents were asked about their spending habits, worries, and influences when it comes to back-to-school expenses. The results revealed that over half of the parents surveyed (54%) will be cutting back their social budgets to pay for back-to-school costs, and 42% will have to limit their utility usage. An overwhelming majority (73%) feel that more should be done by the government and local authorities to help with these costs. Fifty percent of parents surveyed are very concerned about the expenses associated with their child’s return to school.

What Influences Back-to-School Purchasing?
Parents have different sources of influence when deciding what to buy for their children. Recommendations from family and friends were most common (27%), followed by in-store displays (26%). At the bottom of the list were podcasts (7%), social media ads (9%), marketing emails (8%), online blogs (10%), and social influencers (10%).

When Do People Start Back-to-School Shopping?
When it comes to shopping, parents have different time frames for different back-to-school items. A third of parents (33%) surveyed hadn’t started shopping for clothes, shoes, and accessories. For school supplies and backpacks, parents tended to wait until later in August. Only 7% said they already have enough supplies at home and don’t need to purchase anything.
What Are We Buying for Back to School?
New items are the preferred choice for back-to-school shopping. Although the desire to be more environmentally conscious is gaining traction, most parents still opt for brand new items instead of used or hand-me-downs. This trend is especially true for big-ticket items like electronics, with 52% of parents surveyed planning on purchasing new items.
A quarter of parents are willing to buy both new and used items for clothing, shoes, and accessories. The full breakdown of new vs. used vs. a combination of both can be seen below.
Overall, it’s clear that back-to-school season can require significant financial planning on the part of parents. By understanding these spending habits and influences, parents can make informed decisions and start the school year off on the right foot.
New | Used | Combination | |
Health and personal care (e.g. hand sanitizers, toiletries, etc.) | 78% | 7% | 13% |
School supplies (paper, pens, notebooks, calculator, etc.) | 74% | 7% | 18% |
Backpacks / School bags | 73% | 11% | 14% |
Lunch bags/boxes, food containers, water bottles | 71% | 12% | 15% |
Clothing, shoes, and accessories | 68% | 6% | 25% |
Sports equipment | 60% | 13% | 22% |
Dormitory/residence or room essentials (bedding, towels, desk lamps, etc.) | 57% | 15% | 20% |
Electronics and technology (e.g. computer, phone, tablet, printer, etc.) | 52% | 21% | 23% |
How does this compare with your prep for sending your child/ren back to school?
With prices starting from £250 per question and a minimum 4 questions requirement, let’s discuss how the nation can answer your questions quickly, efficiently, and of course cost-effectively.
If you can think of a reason to use the omnibus in the UK, EU, USA, or Canada do get in touch, if you are not sure and want to talk, get in touch with [email protected] and we can discuss this or any of your research queries (qual or quant).
Methodology
These findings are from a study released by Sago between August 4-7, 2023, among a random selection of N = 2,680 of GB adults ages 18+ of whom N = 847 are parents of school aged children. All are online panelists of Sago’s Community. The results were weighted by age, gender, region, and ethnicity to match the population, according to Census data. For comparison purposes, a probability sample of this size has an estimated margin of error (which measures sampling variability) of +/- 2.5%, 19 times out of 20. Discrepancies in or between totals when compared to the data tables are due to rounding. Excerpts from this release of findings should be properly attributed, with interpretation subject to clarification or correction.
Sago is the global research and data partner that connects human answers to business questions. Combining a legacy of impact, global reach, and innovative spirit, Sago enables clients to solve business problems through extensive audience access and an adaptive range of qualitative and quantitative solutions.
Quickly Run Your Own Study
Searching for fast, timely insights like these? Turn to Sago’s Rapid Alert Omnibus for a simple, efficient way to gather the data you need.