


Customer experience management (CXM) programs are necessarily a quantitative endeavor, requiring CX professionals to decipher insights from a sea of customer data. In this post, I will illustrate how you can use IBM Watson Studio to analyze one source of customer data, customer survey responses, to answer two important questions about the health of your customer relationship: 1) what is the current level of satisfaction across the CX touch points and 2) which of these touch points is responsible for ensuring customers are loyal?
Customer Experience Management (CXM) programs rely on different types of data that come from a variety of sources. The most popular source of customer feedback is surveys. Customer surveys are used to help you answer two broad questions about the health of your customer relationship:
- What is the current level of customer satisfaction with different aspects of your business (i.e., product, ease of doing business, technical support)?
- What is the likelihood your customers will exhibit different types of loyalty behaviors toward your company or brand (e.g., likelihood to stay, recommend and buy more).
These two questions will help you understand how well you are meeting the needs of your customers and, more importantly, understand what you need to do to improve customer loyalty. In today’s post, I will present a case study to illustrate how you can use IBM Watson Studio to answer these two questions.
Why IBM Watson Studio?
IBM Watson Studio, an end-to-end analytics solution to help you gain insights from your data, was designed for data scientists, application developers and subject matter experts to collaboratively and easily work with data to build and train models at scale. Of the different deployment options that are available for IBM Watson Studio, I signed up for IBM Watson Studio Desktop and I will be using this deployment in this post.
IBM is using the power of its Watson Studio platform to extend the power of AI to people who fall outside the realm of data science, machine learning and AI experts. IBM Watson Studio is an end-to-end analytics solution to help you gain insights from your data. Watson Studio accomplished this feat by providing a platform to help you prepare data and build models on your own desktop using their easy-to-use visual drag and drop tools.
Before diving into IBM Watson Studio, it’s important to give some background on both the survey data and the analytics behind driver analysis.
Case Study: The Survey Data
A company conducts an annual customer relationship survey to help them understand and improve the health of the customer relationship. Using a 0 (Extremely Dissatisfied) to 10 (Extremely Satisfied) scale, the customer relationship survey asked customers to indicate how satisfied they are with the customer experience across eight business areas or touch points:
- Ease of Doing Business
- Account Management
- Overall Product Quality
- Purchasing/Invoicing/Delivery
- Utility of Web site
- Technical Support
- Communications from the Company
- Future Product/Company Direction
Using a 0 (Not at all likely) to 10 (Extremely likely) scale, the survey also asked customers to indicate their likelihood of engaging in different types of loyalty behaviors:
- Advocacy Loyalty (e.g, likelihood to recommend, buy again, overall sat)
- Purchasing Loyalty (e.g, likelihood to expand usage, buy different types of products/services)
- Retention Loyalty (e.g., likelihood of renewing service contract, staying)
IBM Watson Studio Desktop
To answer the two questions posed earlier, I will follow a 5-step process for the current case study:
- Load Data
- Add and Prepare Data
- Explore Data
- Analyze Data
- Communicate Results
To use IBM Watson Studio, simply follow the instructions to install it on your desktop. 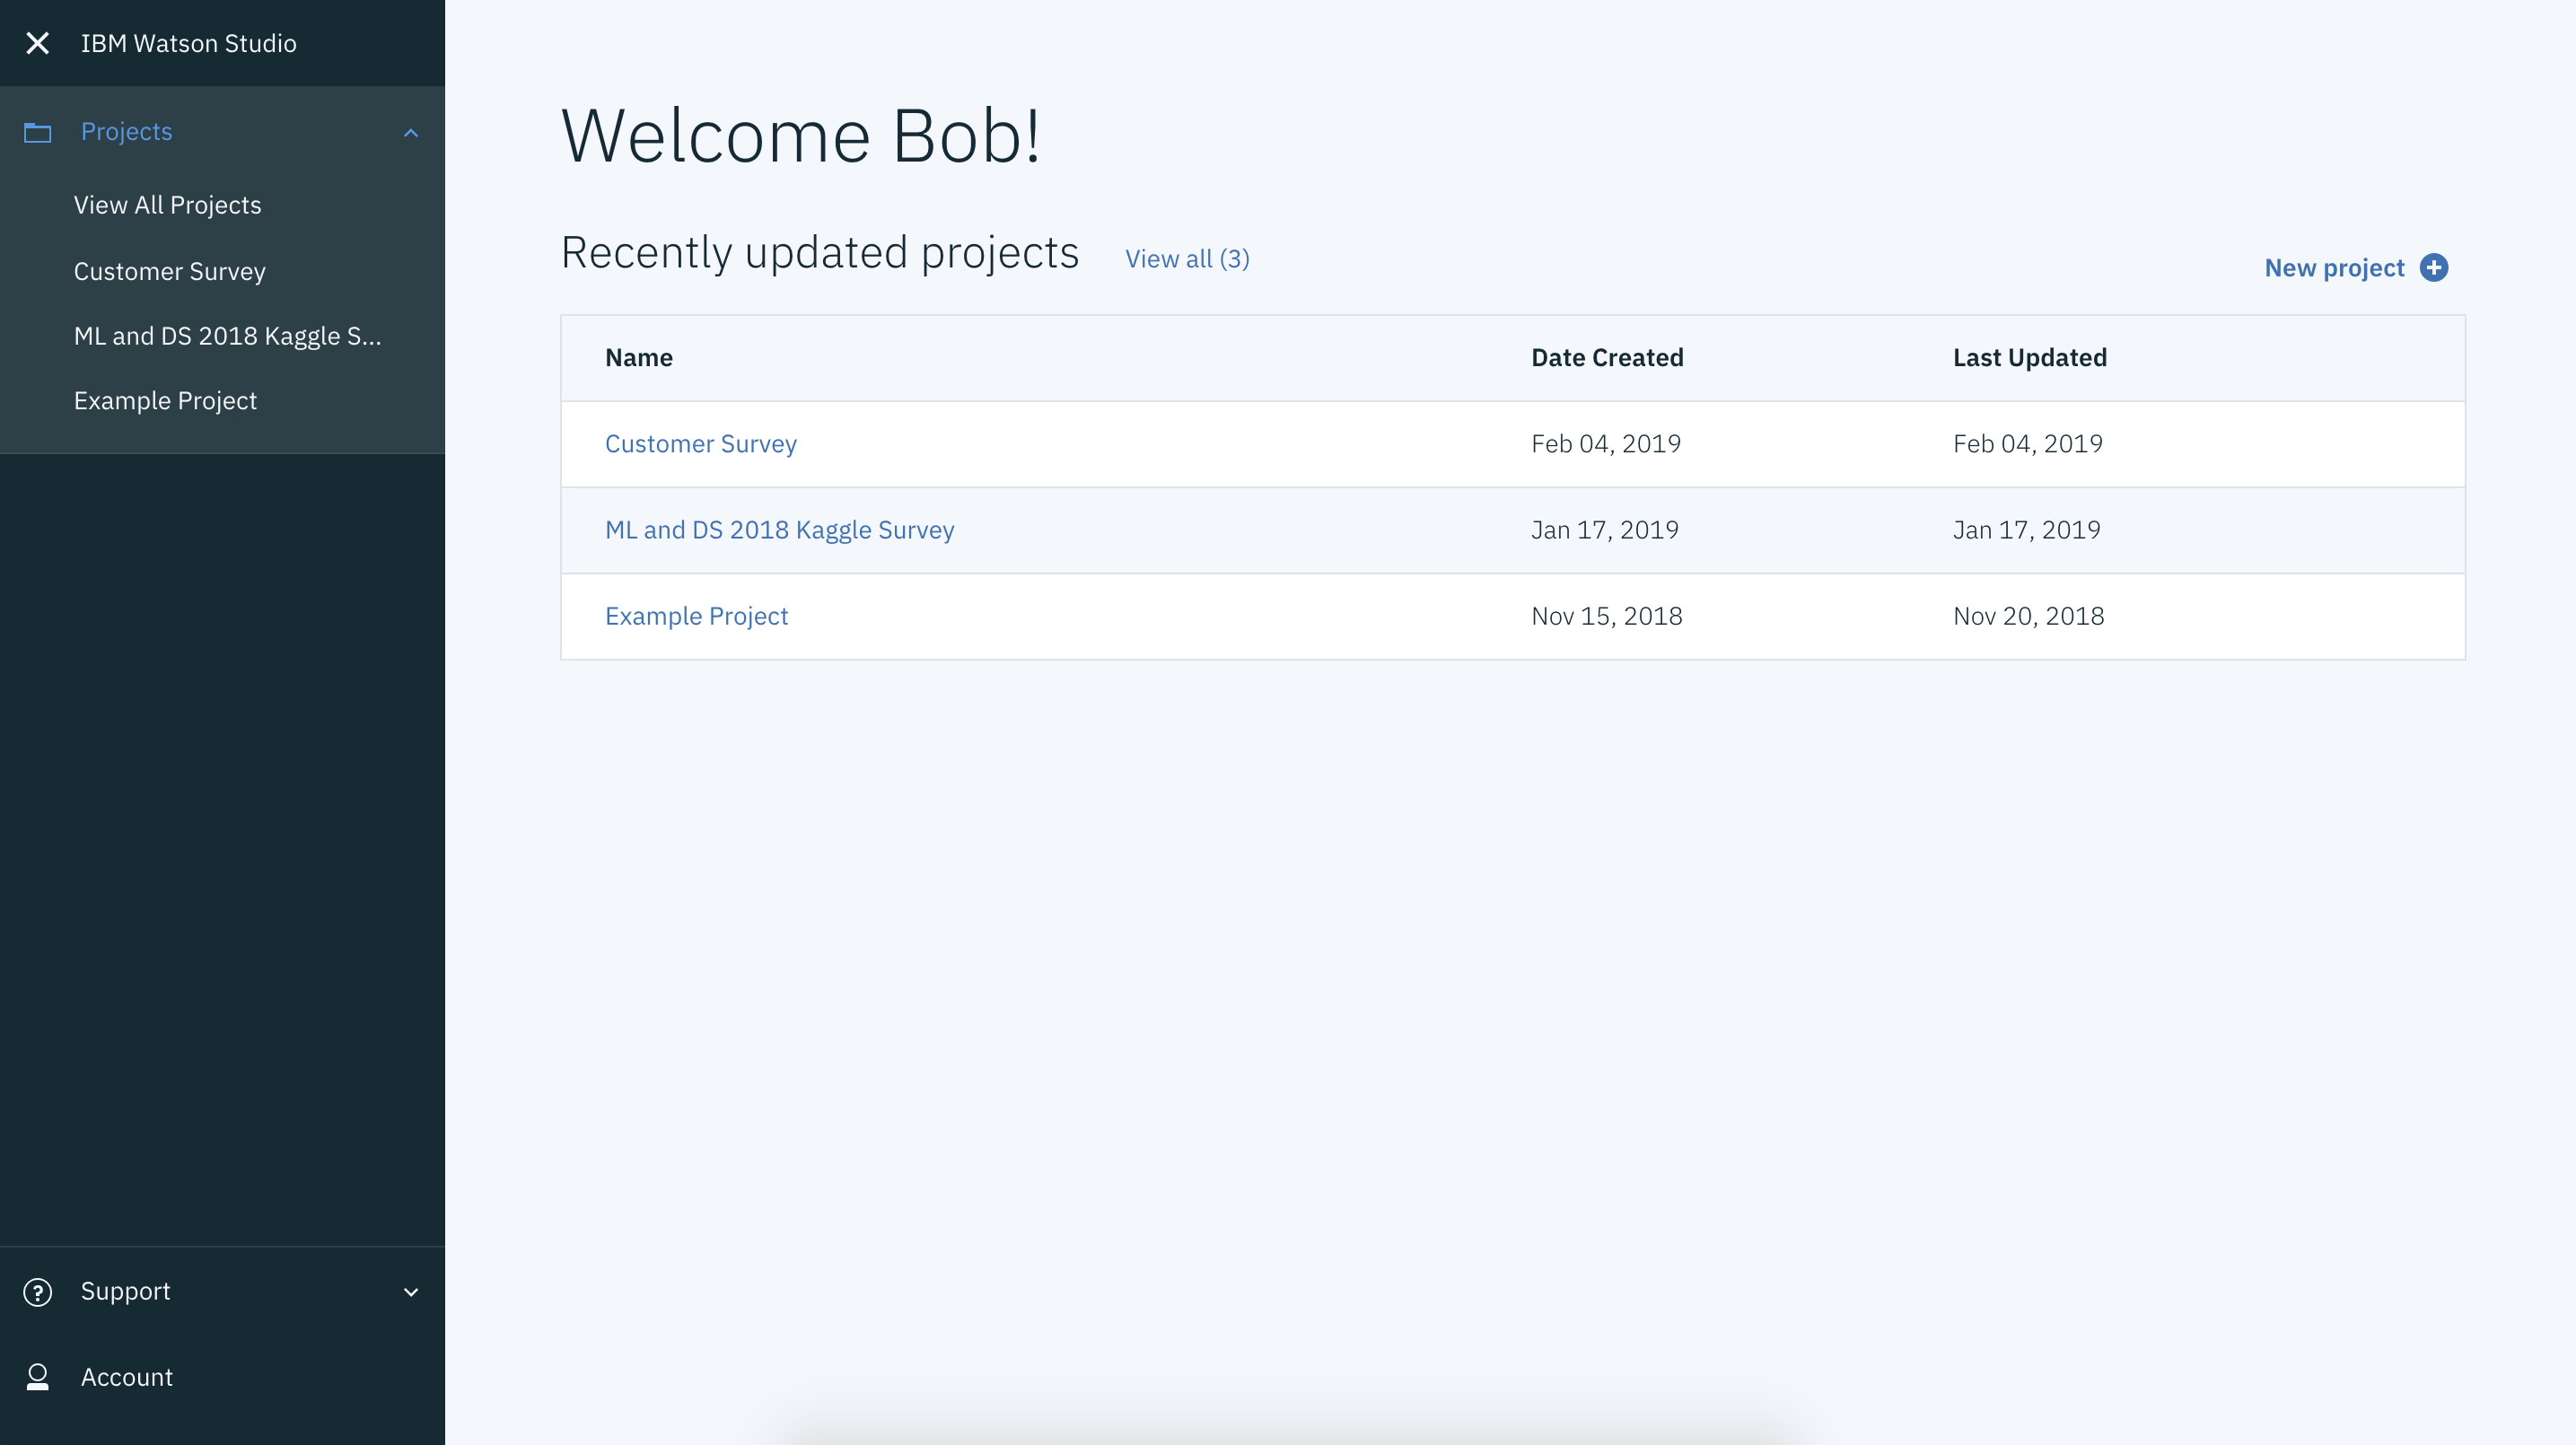 After installing and logging into the Watson Studio platform, you can create a new project or manage an existing project. In the screenshot above, you can see that I already have three projects. I will click on the New Project button to create a new project.
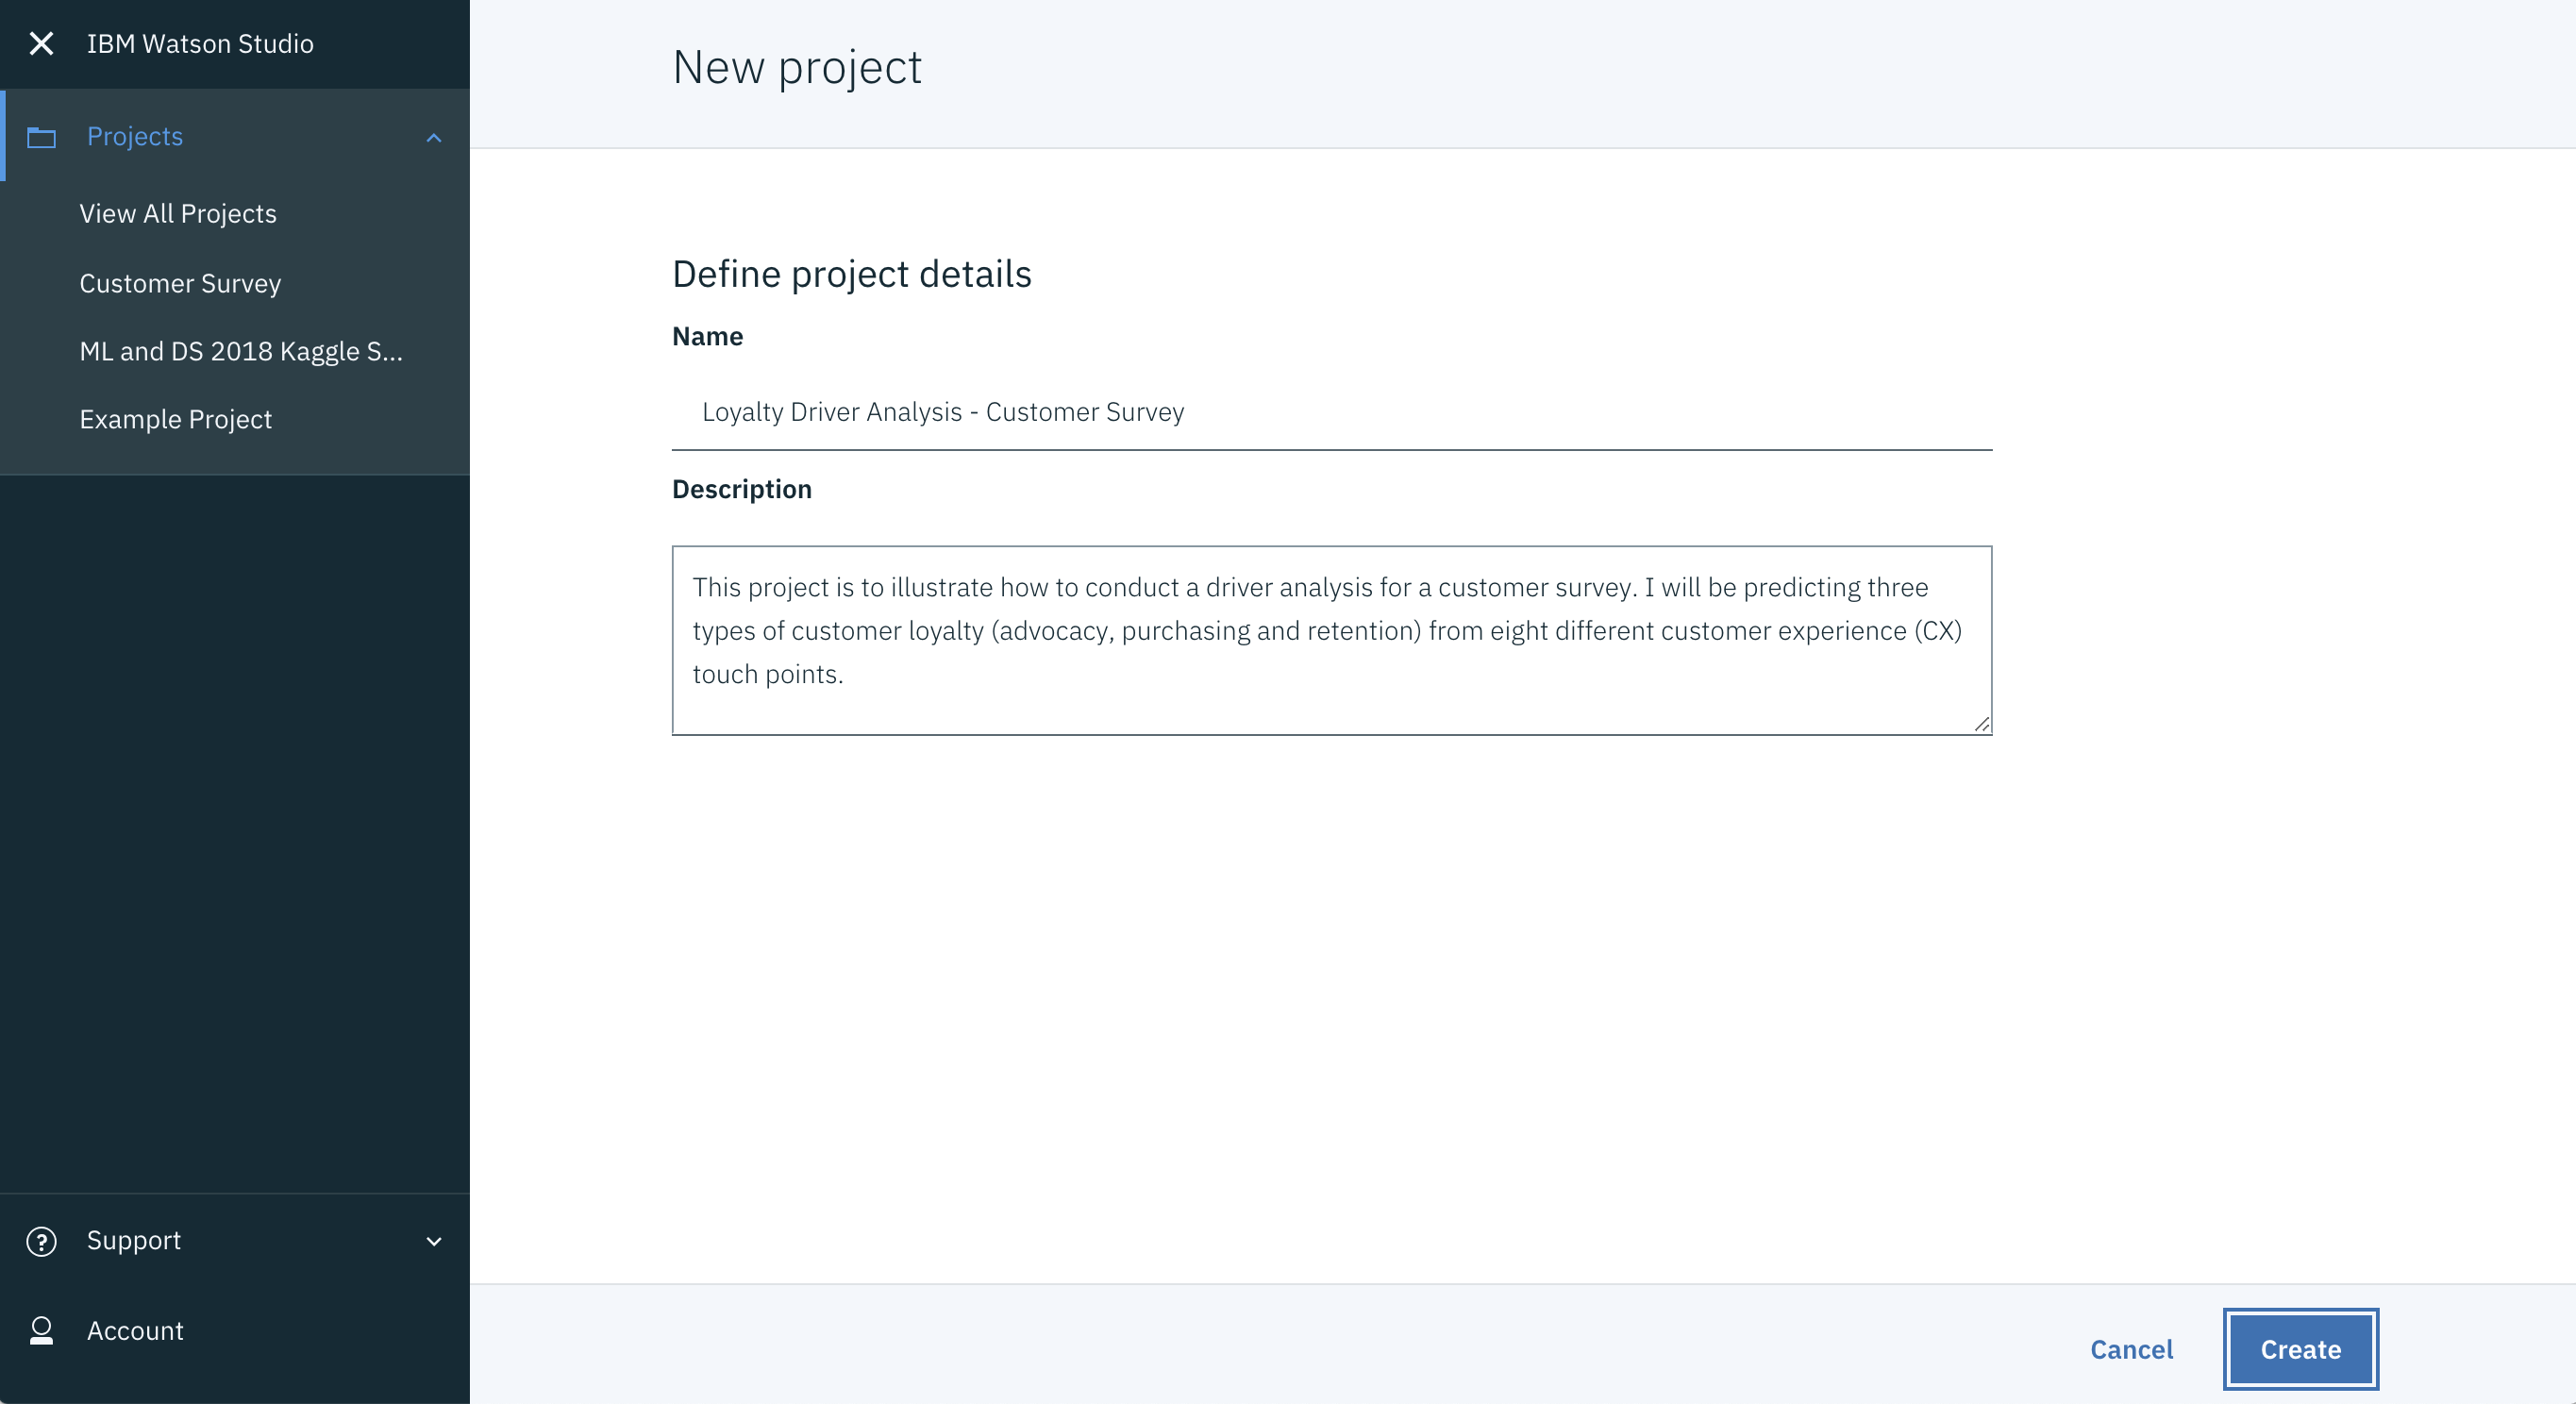
Next I will create a New Project in which I will try to answer the two important questions.
1. Load Data
The first step is to load the data into Watson Studio. The raw survey data are in an Excel spreadsheet, with the columns representing the different variables in your data set. Using machine learning nomenclature, think of the customer experience (CX) touch points as the features of your model and the three different types of customer loyalty as your outcomes or criteria.
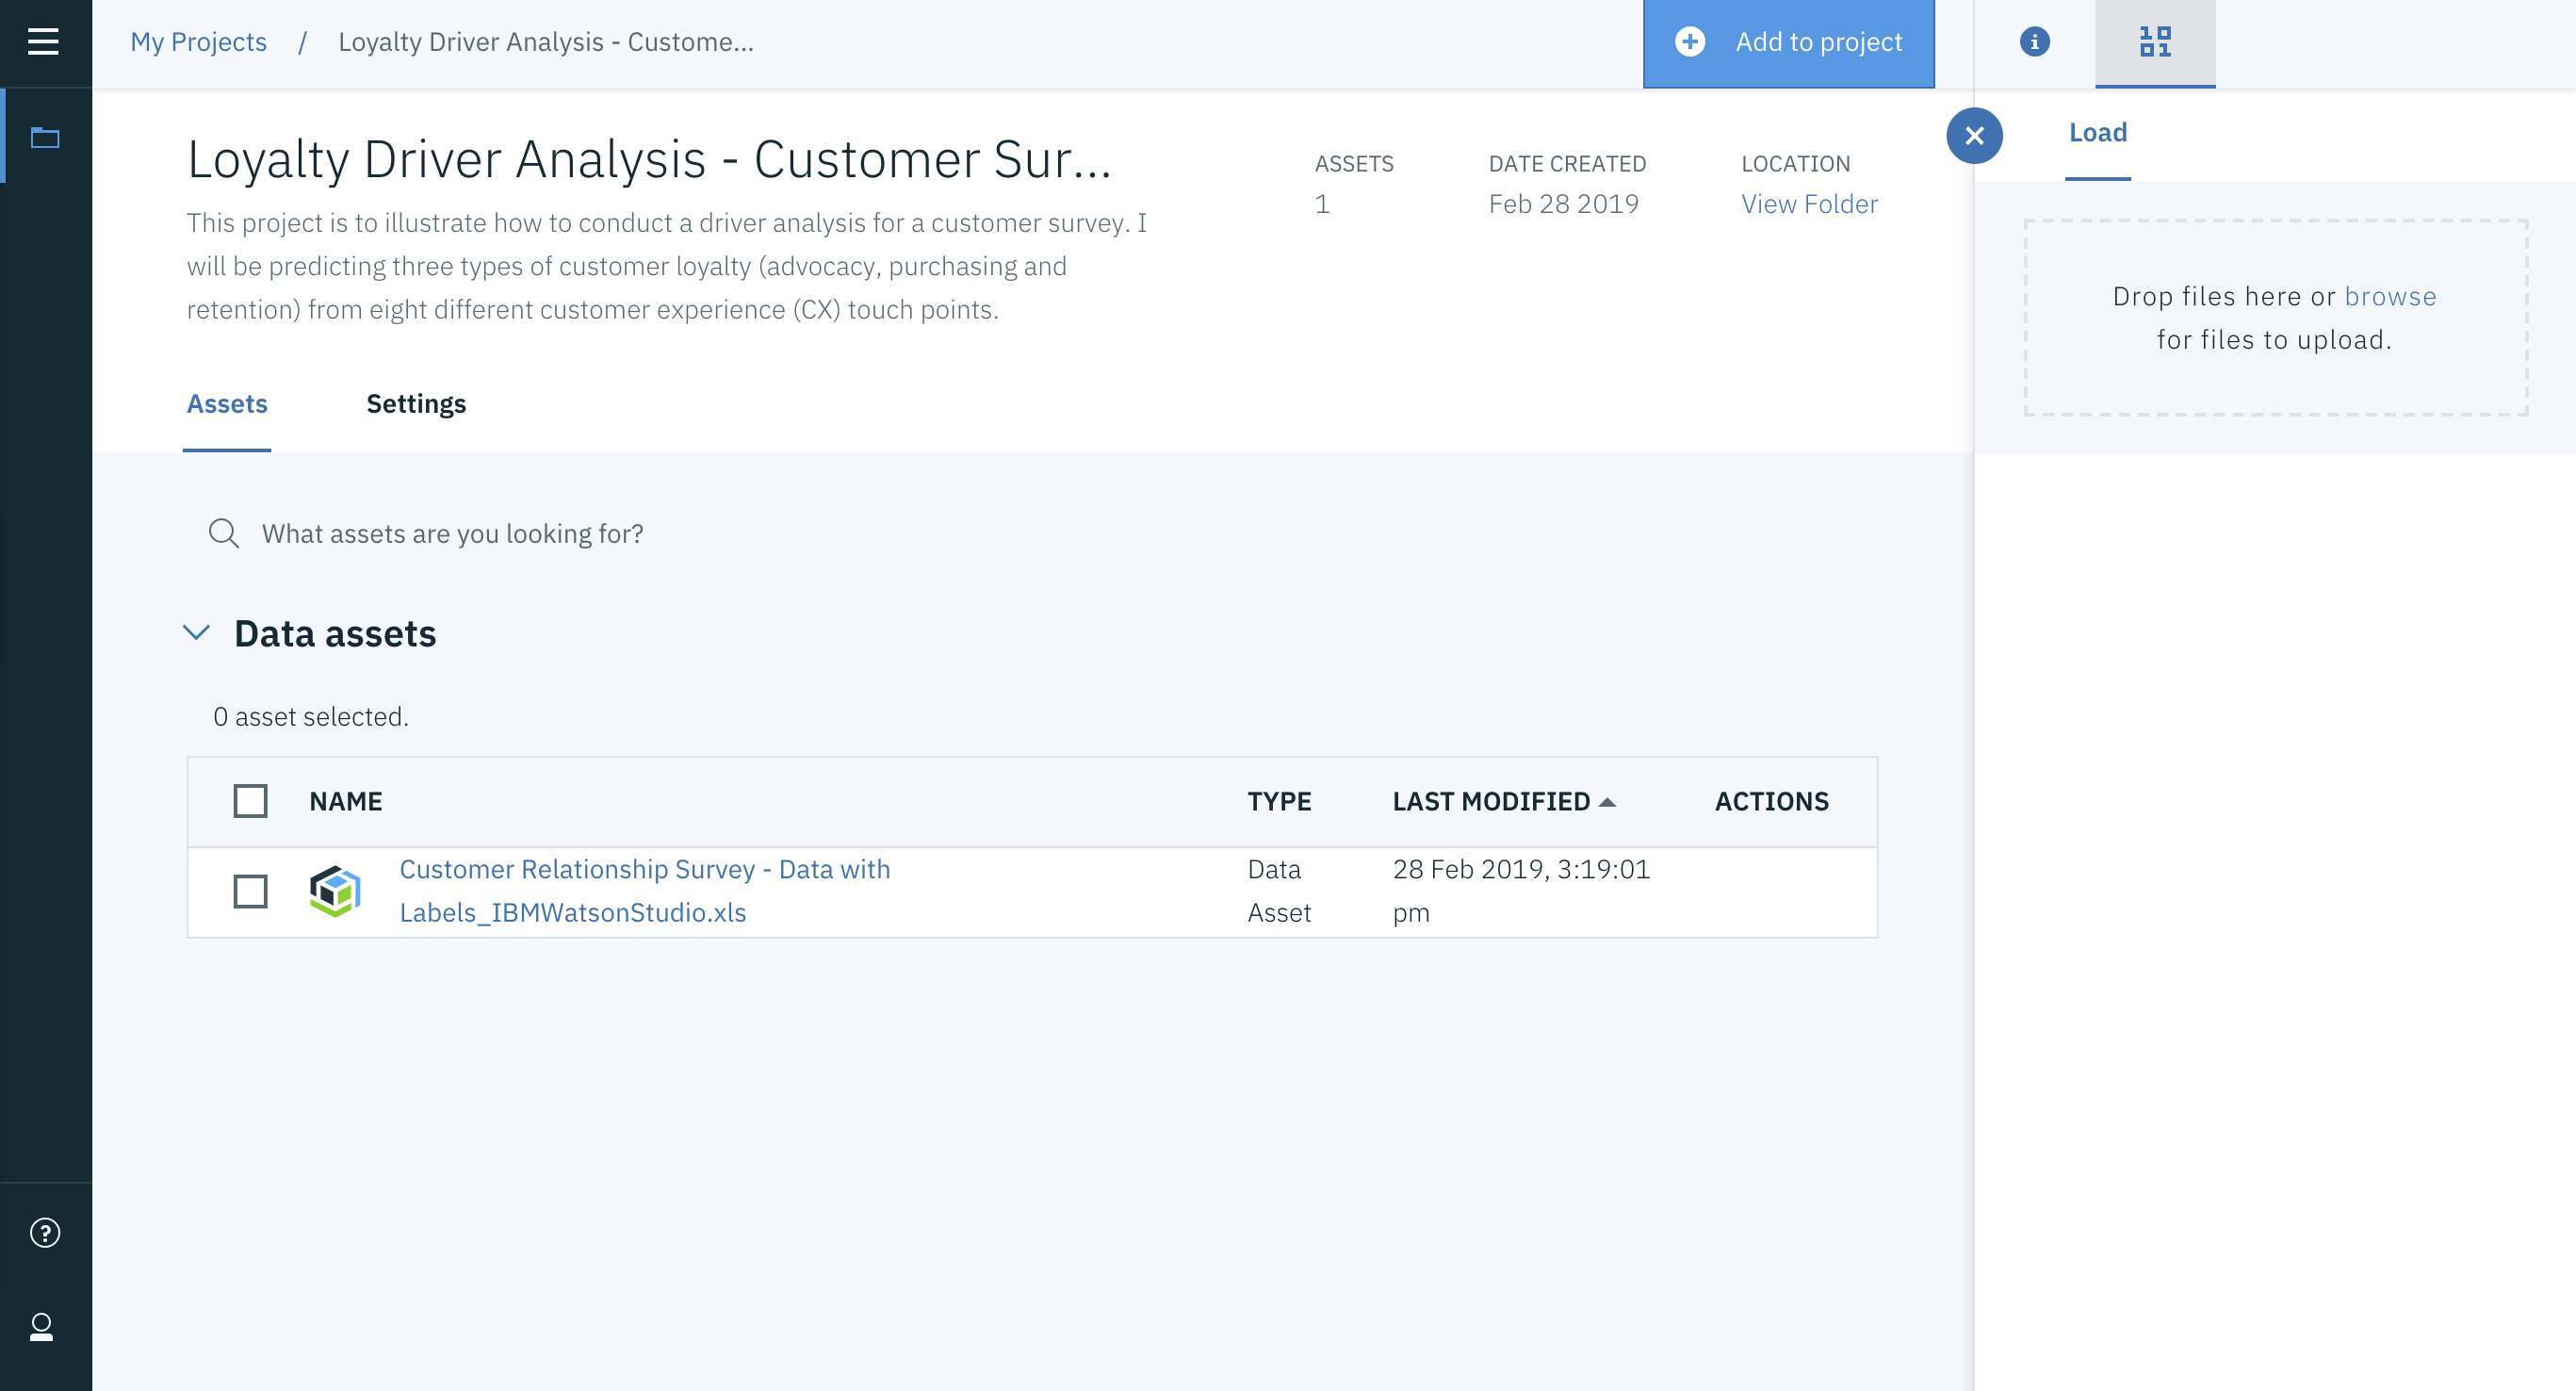 I uploaded this data set by clicking on the upper right “browse for files to upload” link and selecting it from my laptop. That data set will be stored as a Data asset.
2. Add and Prepare Data
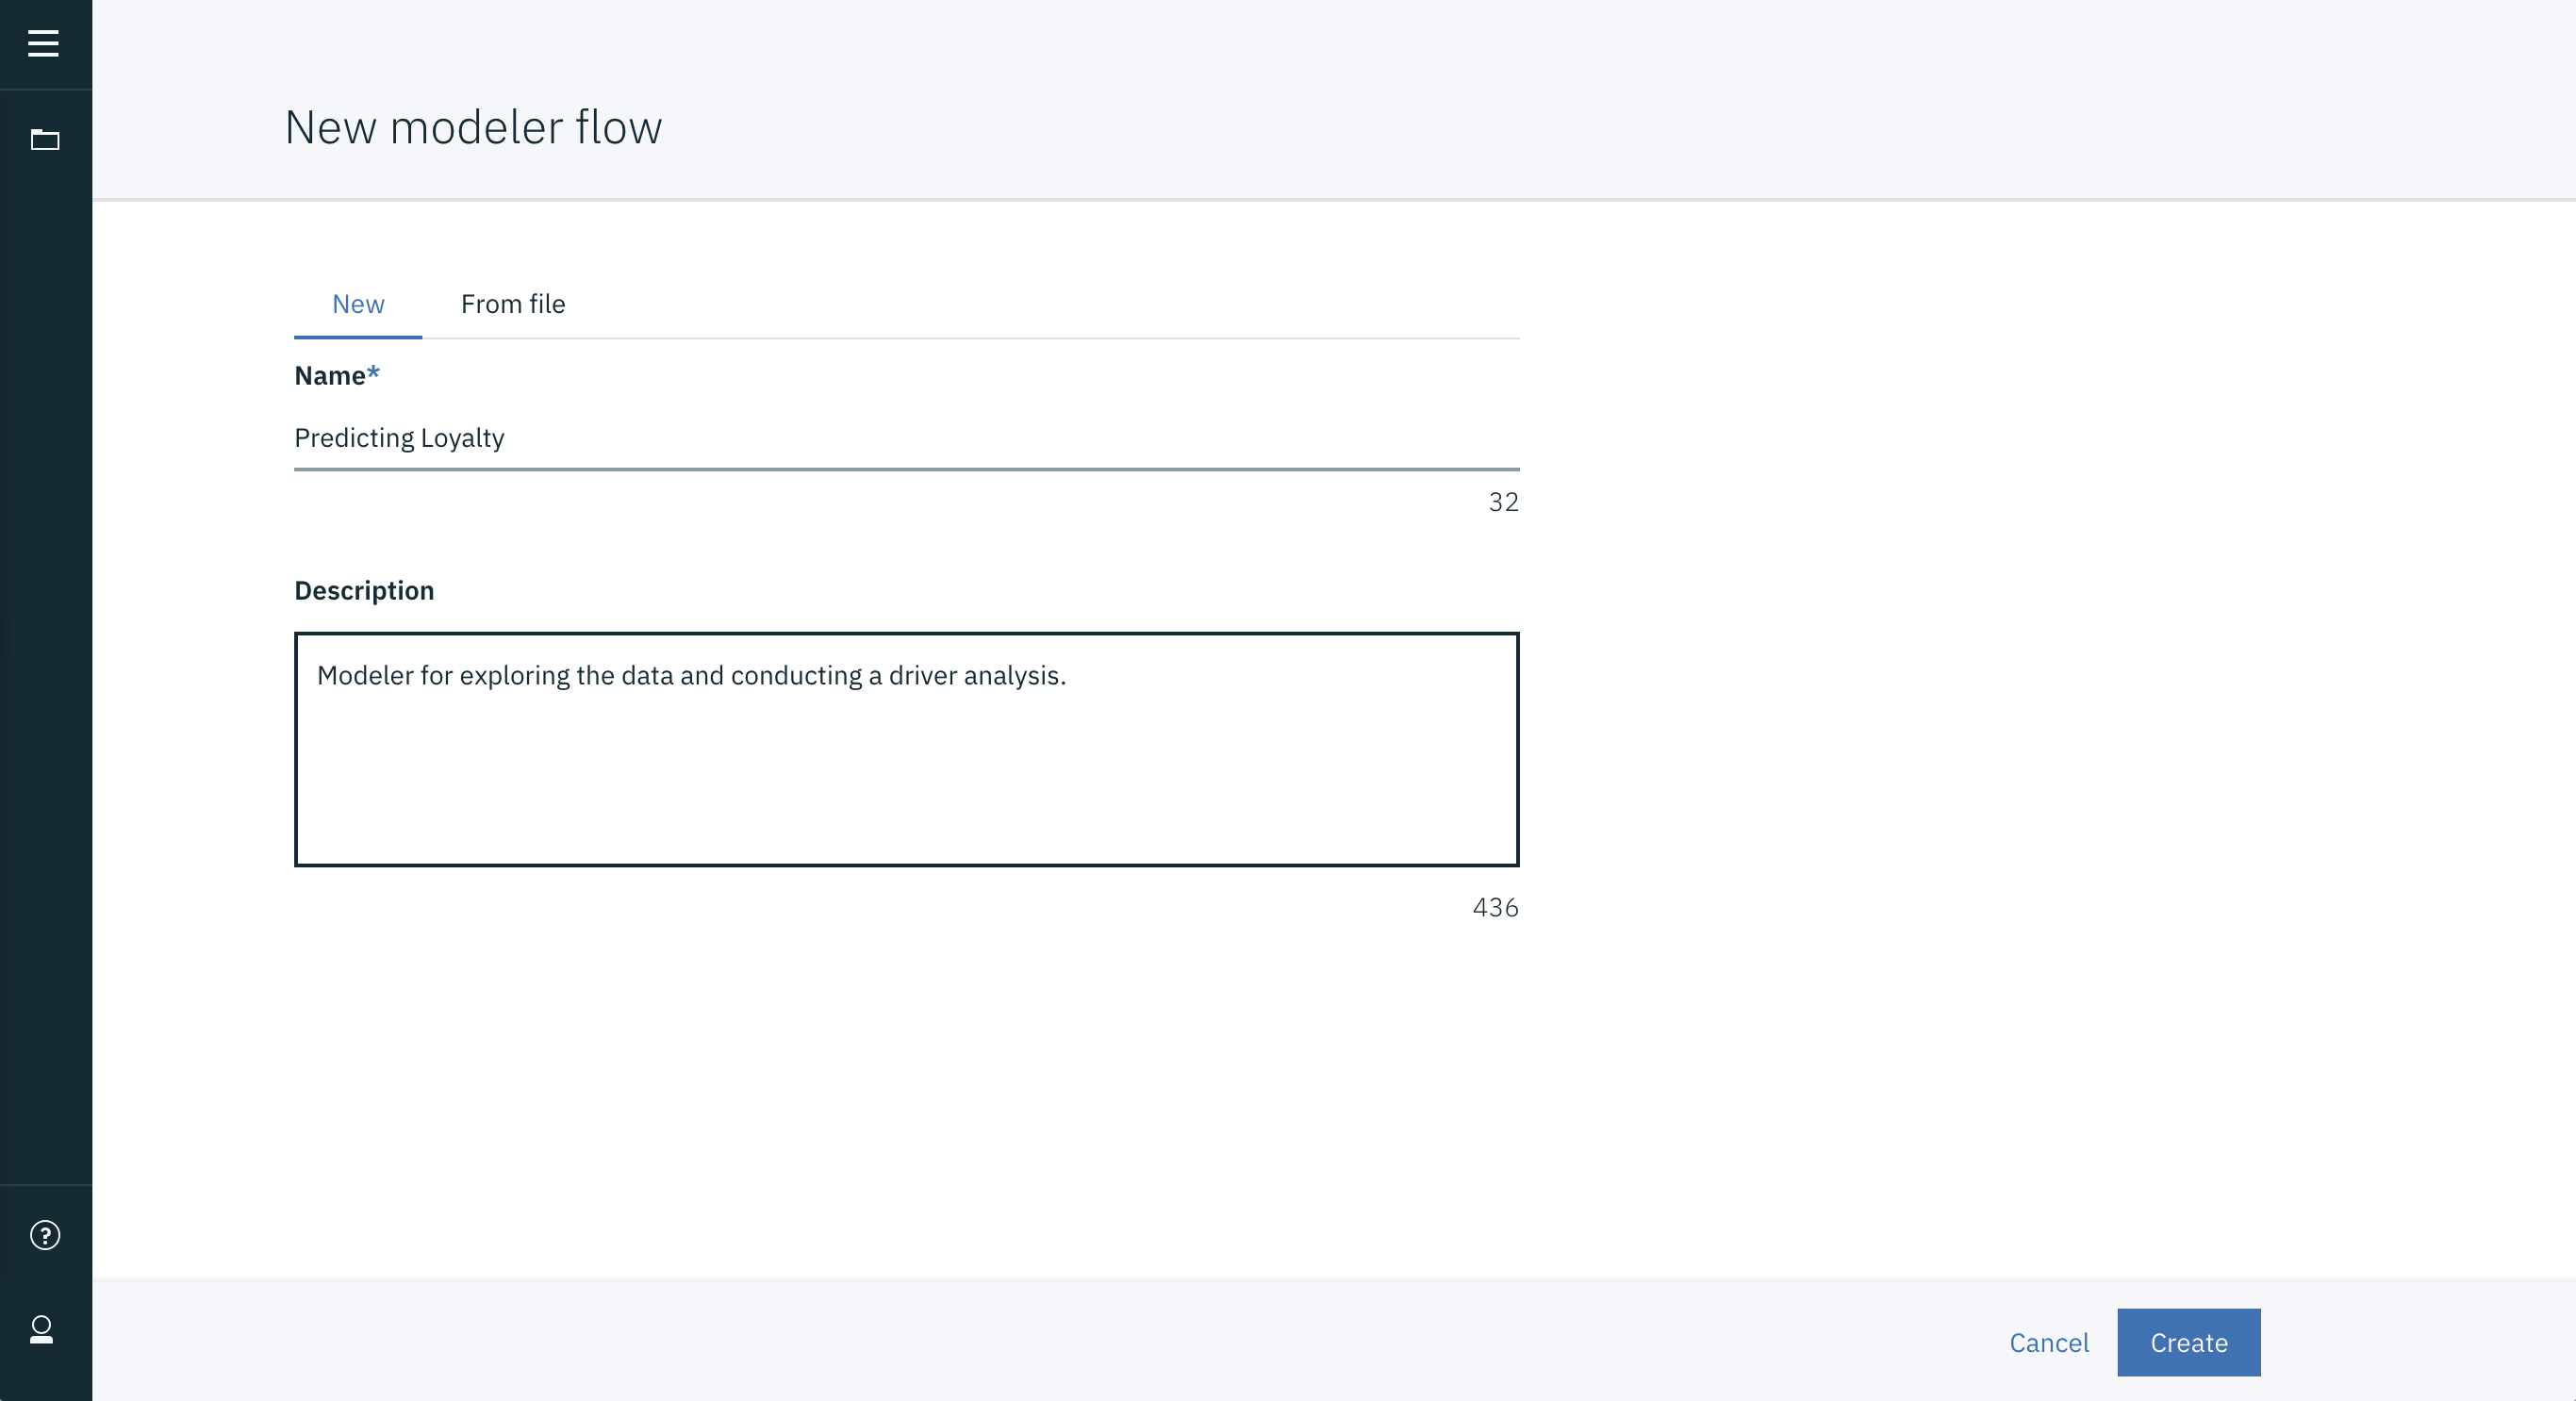
After you have uploaded your data set to Watson Studio, the next step is to explore the data set to better understand the variables in your data set. Watson Studio uses a Modeler Flow (click Add to project button) to help you with this task and other, more in-depth analyses.
The Modeler Flow is based on IBM SPSS Modeler that uses Nodes to perform certain functions on your data. The various Nodes can be found in the Palette window on the left side of the application.
Add Data. In this step we need to first import the data asset to the Modeler Flow. Simply drag and drop the Data Asset Node into the main part of the Modeler Flow window and then double-click the icon to find and connect your data set.
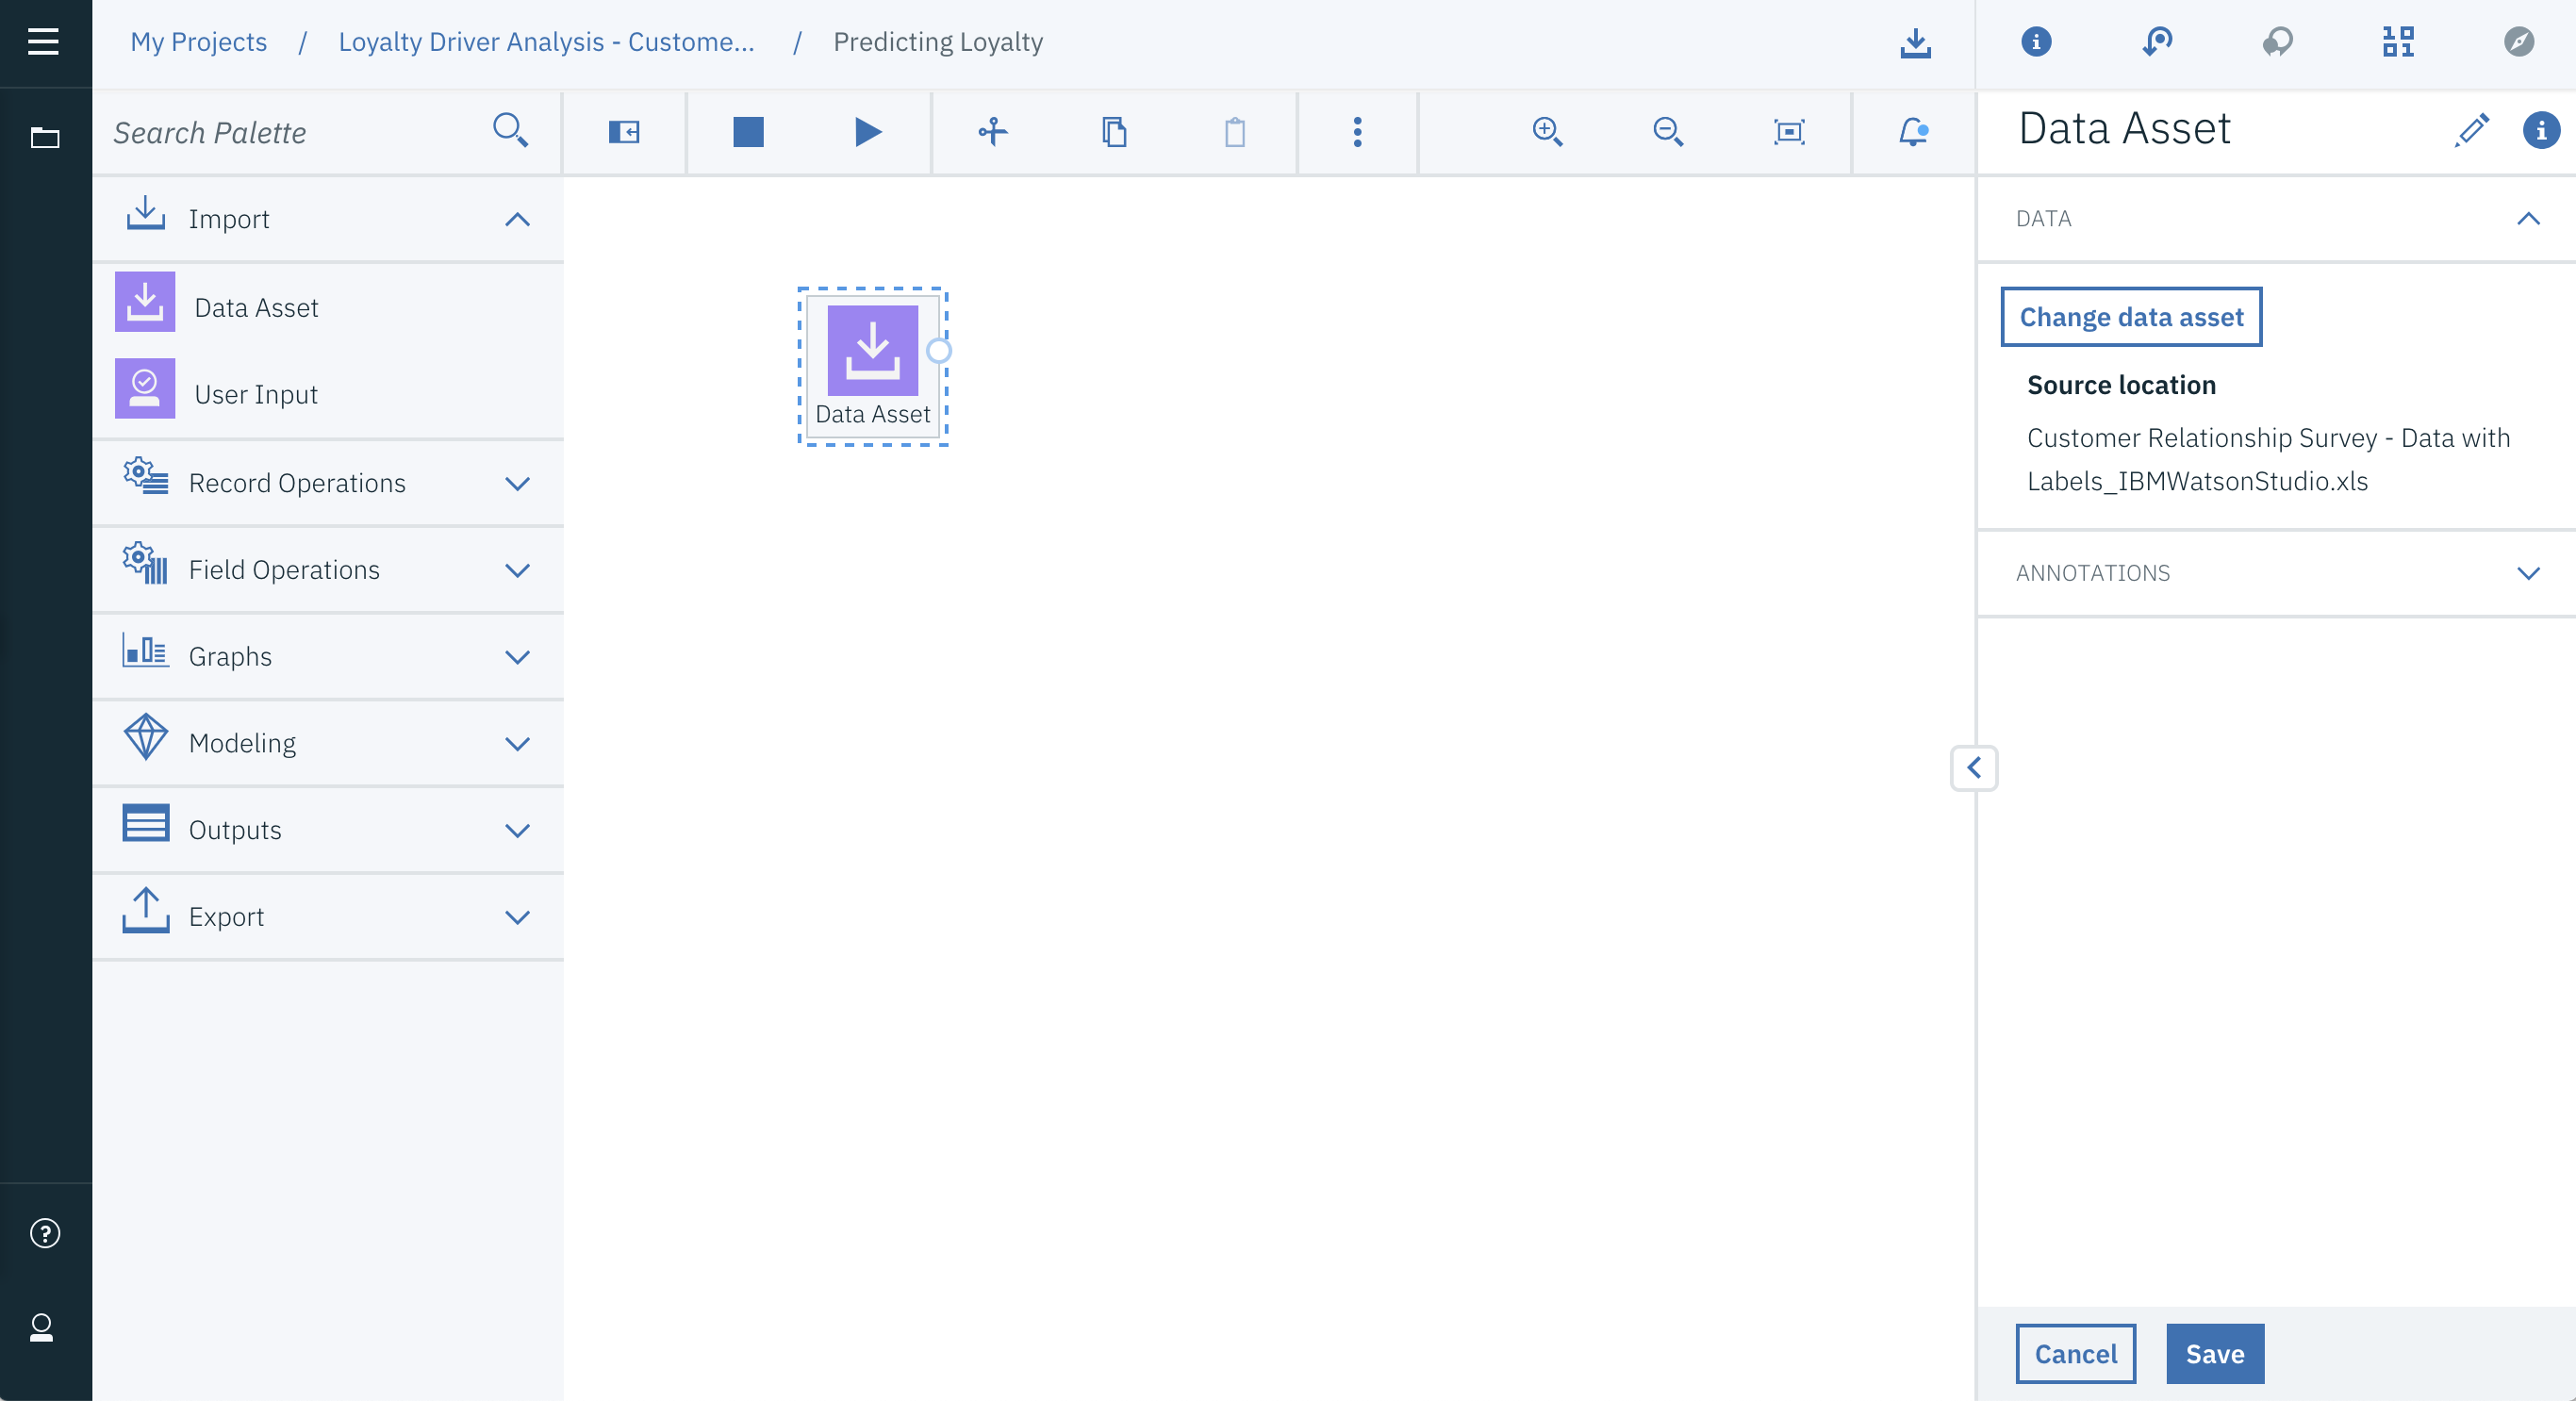
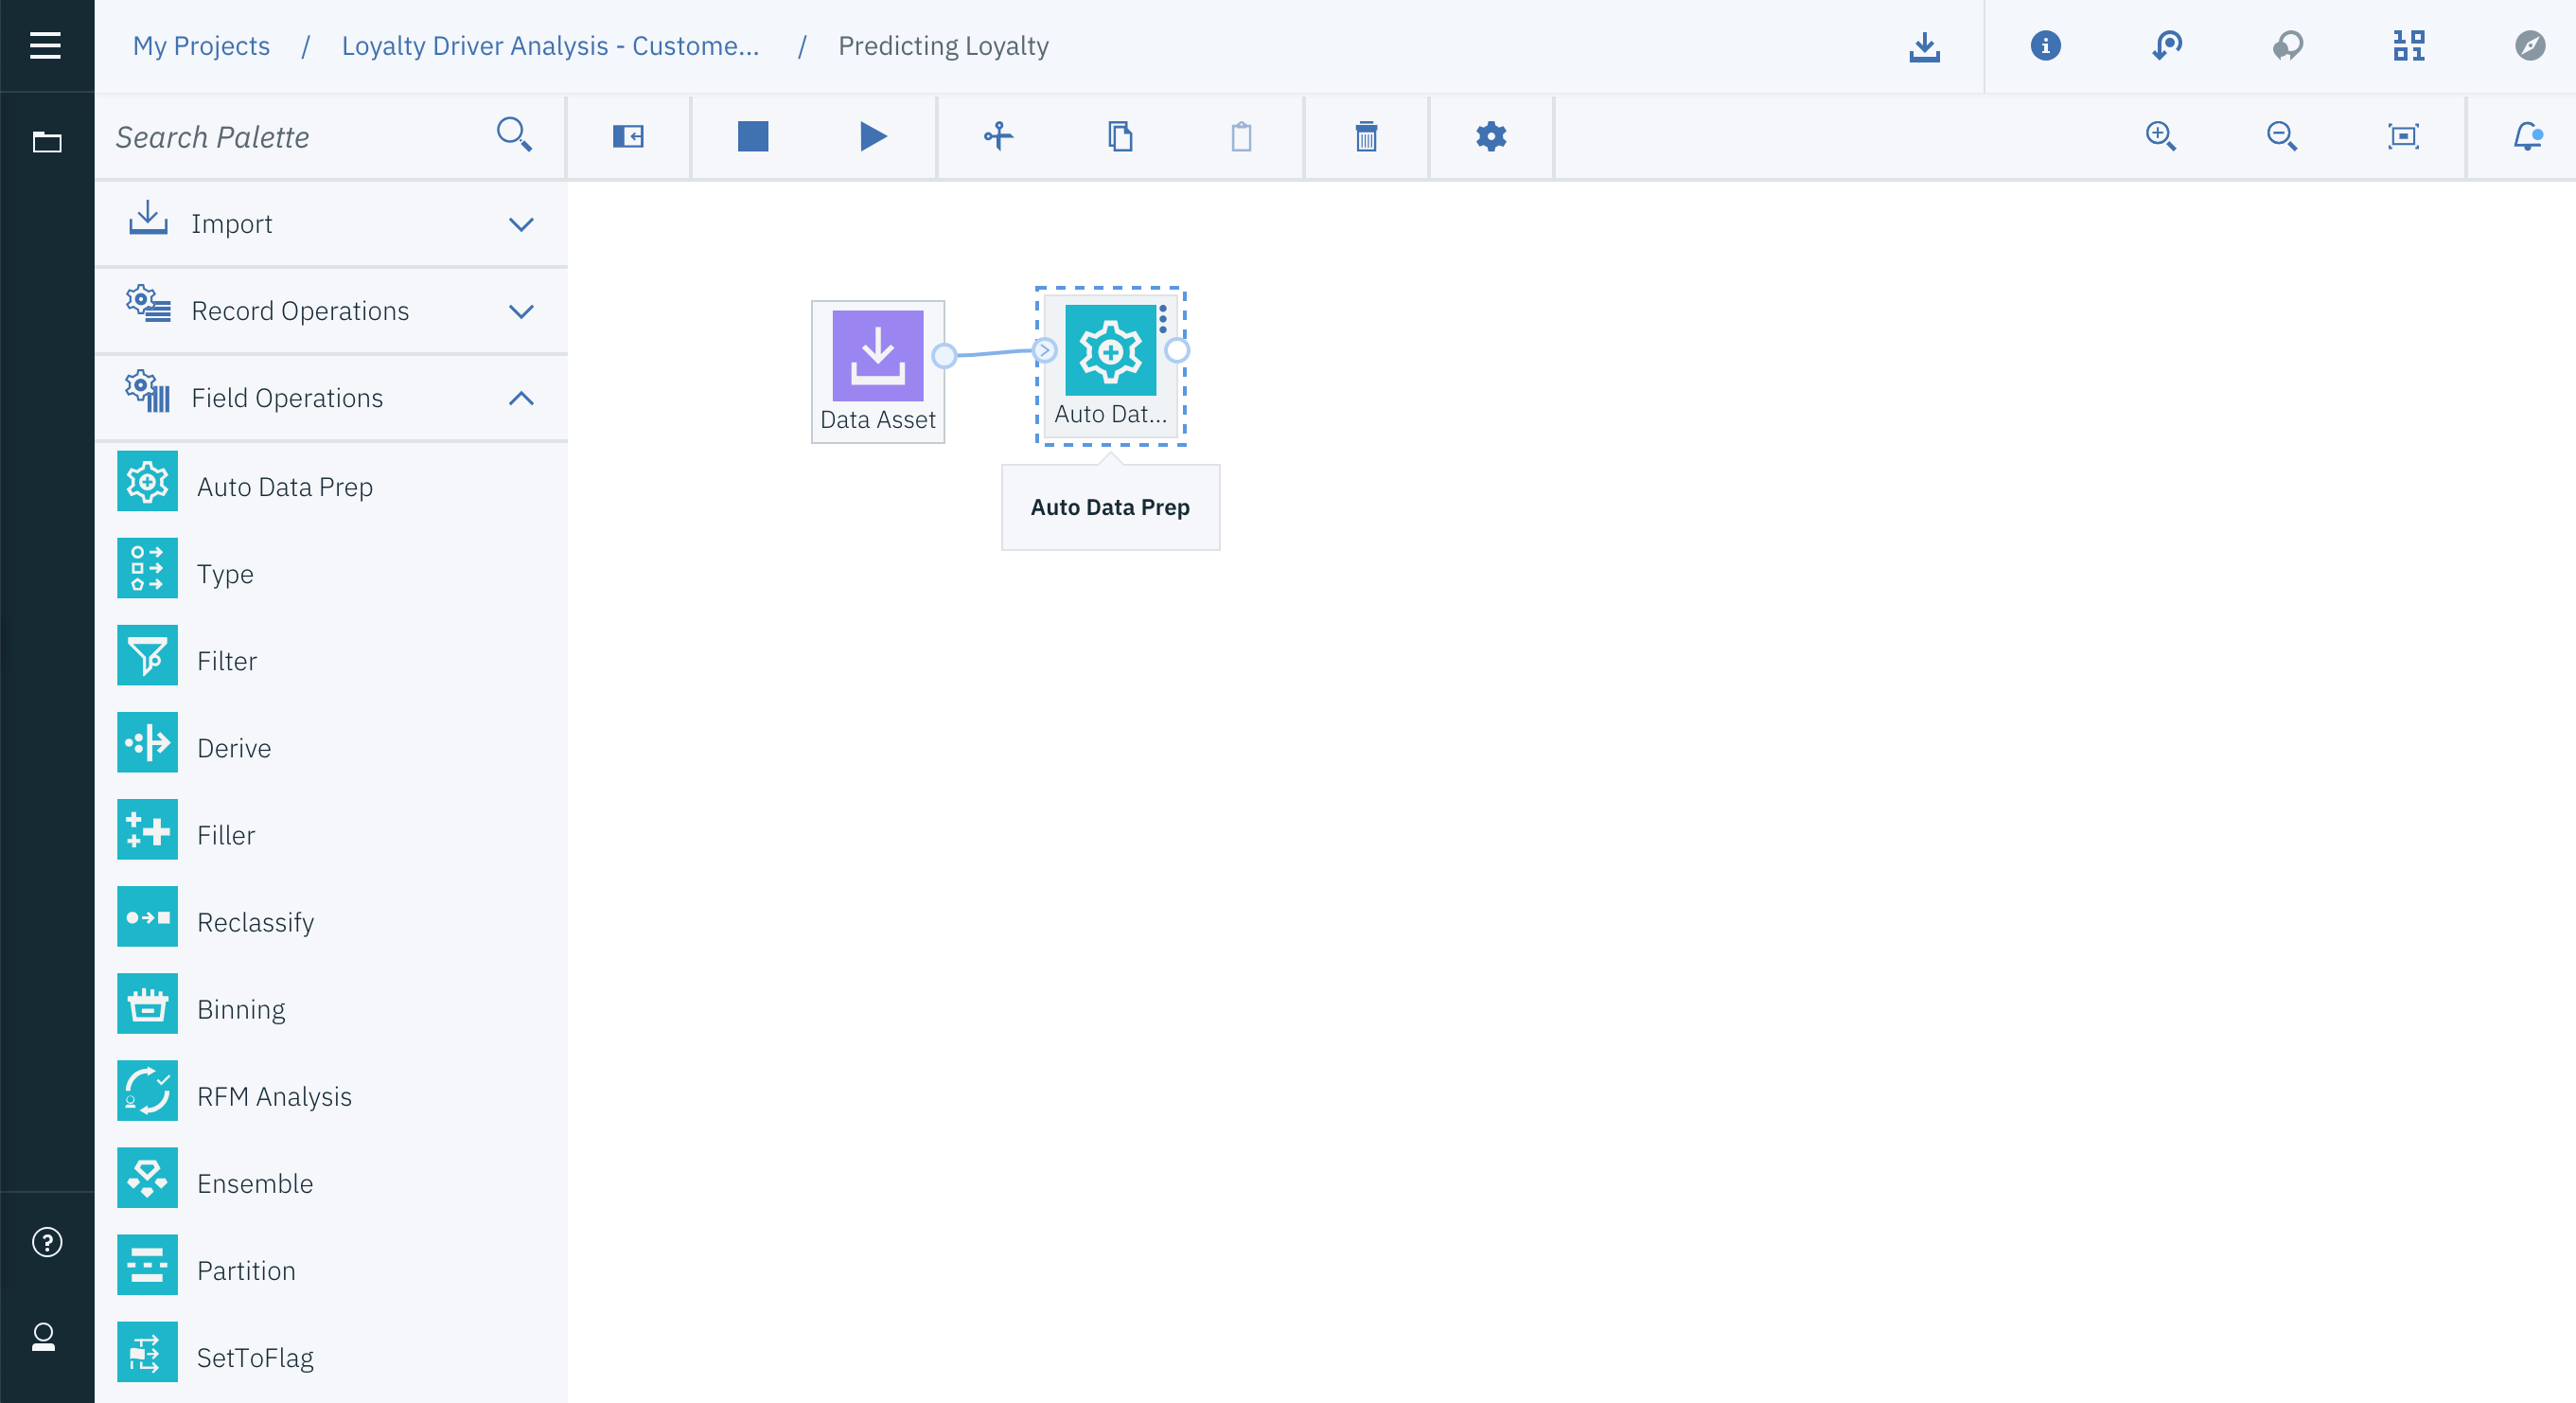
Prepare Data. Next, you will need to prepare your data for exploration and analysis. Simply drag and drop the Auto Data Prep Node into the Modeler Flow window. The Auto Data Prep Node automatically prepares your data for analysis (e.g., changing strings to numerical values). Connect the two nodes by clicking and dragging from the two circles on the respective Nodes.
Next, to view the prepared data, simply click the upper right corner of the Auto Data Prep Node and click “Preview.” A new window will open with the new data. I see that, although my raw data were originally in string/text format (even though they were numbers), the Auto Data Prep Node transformed those values to numerical format. In addition to automatically preparing your data, Watson Studio lets gives you options to conduct additional operations, including filtering and binning variables as well as selecting samples.
3. Explore Data
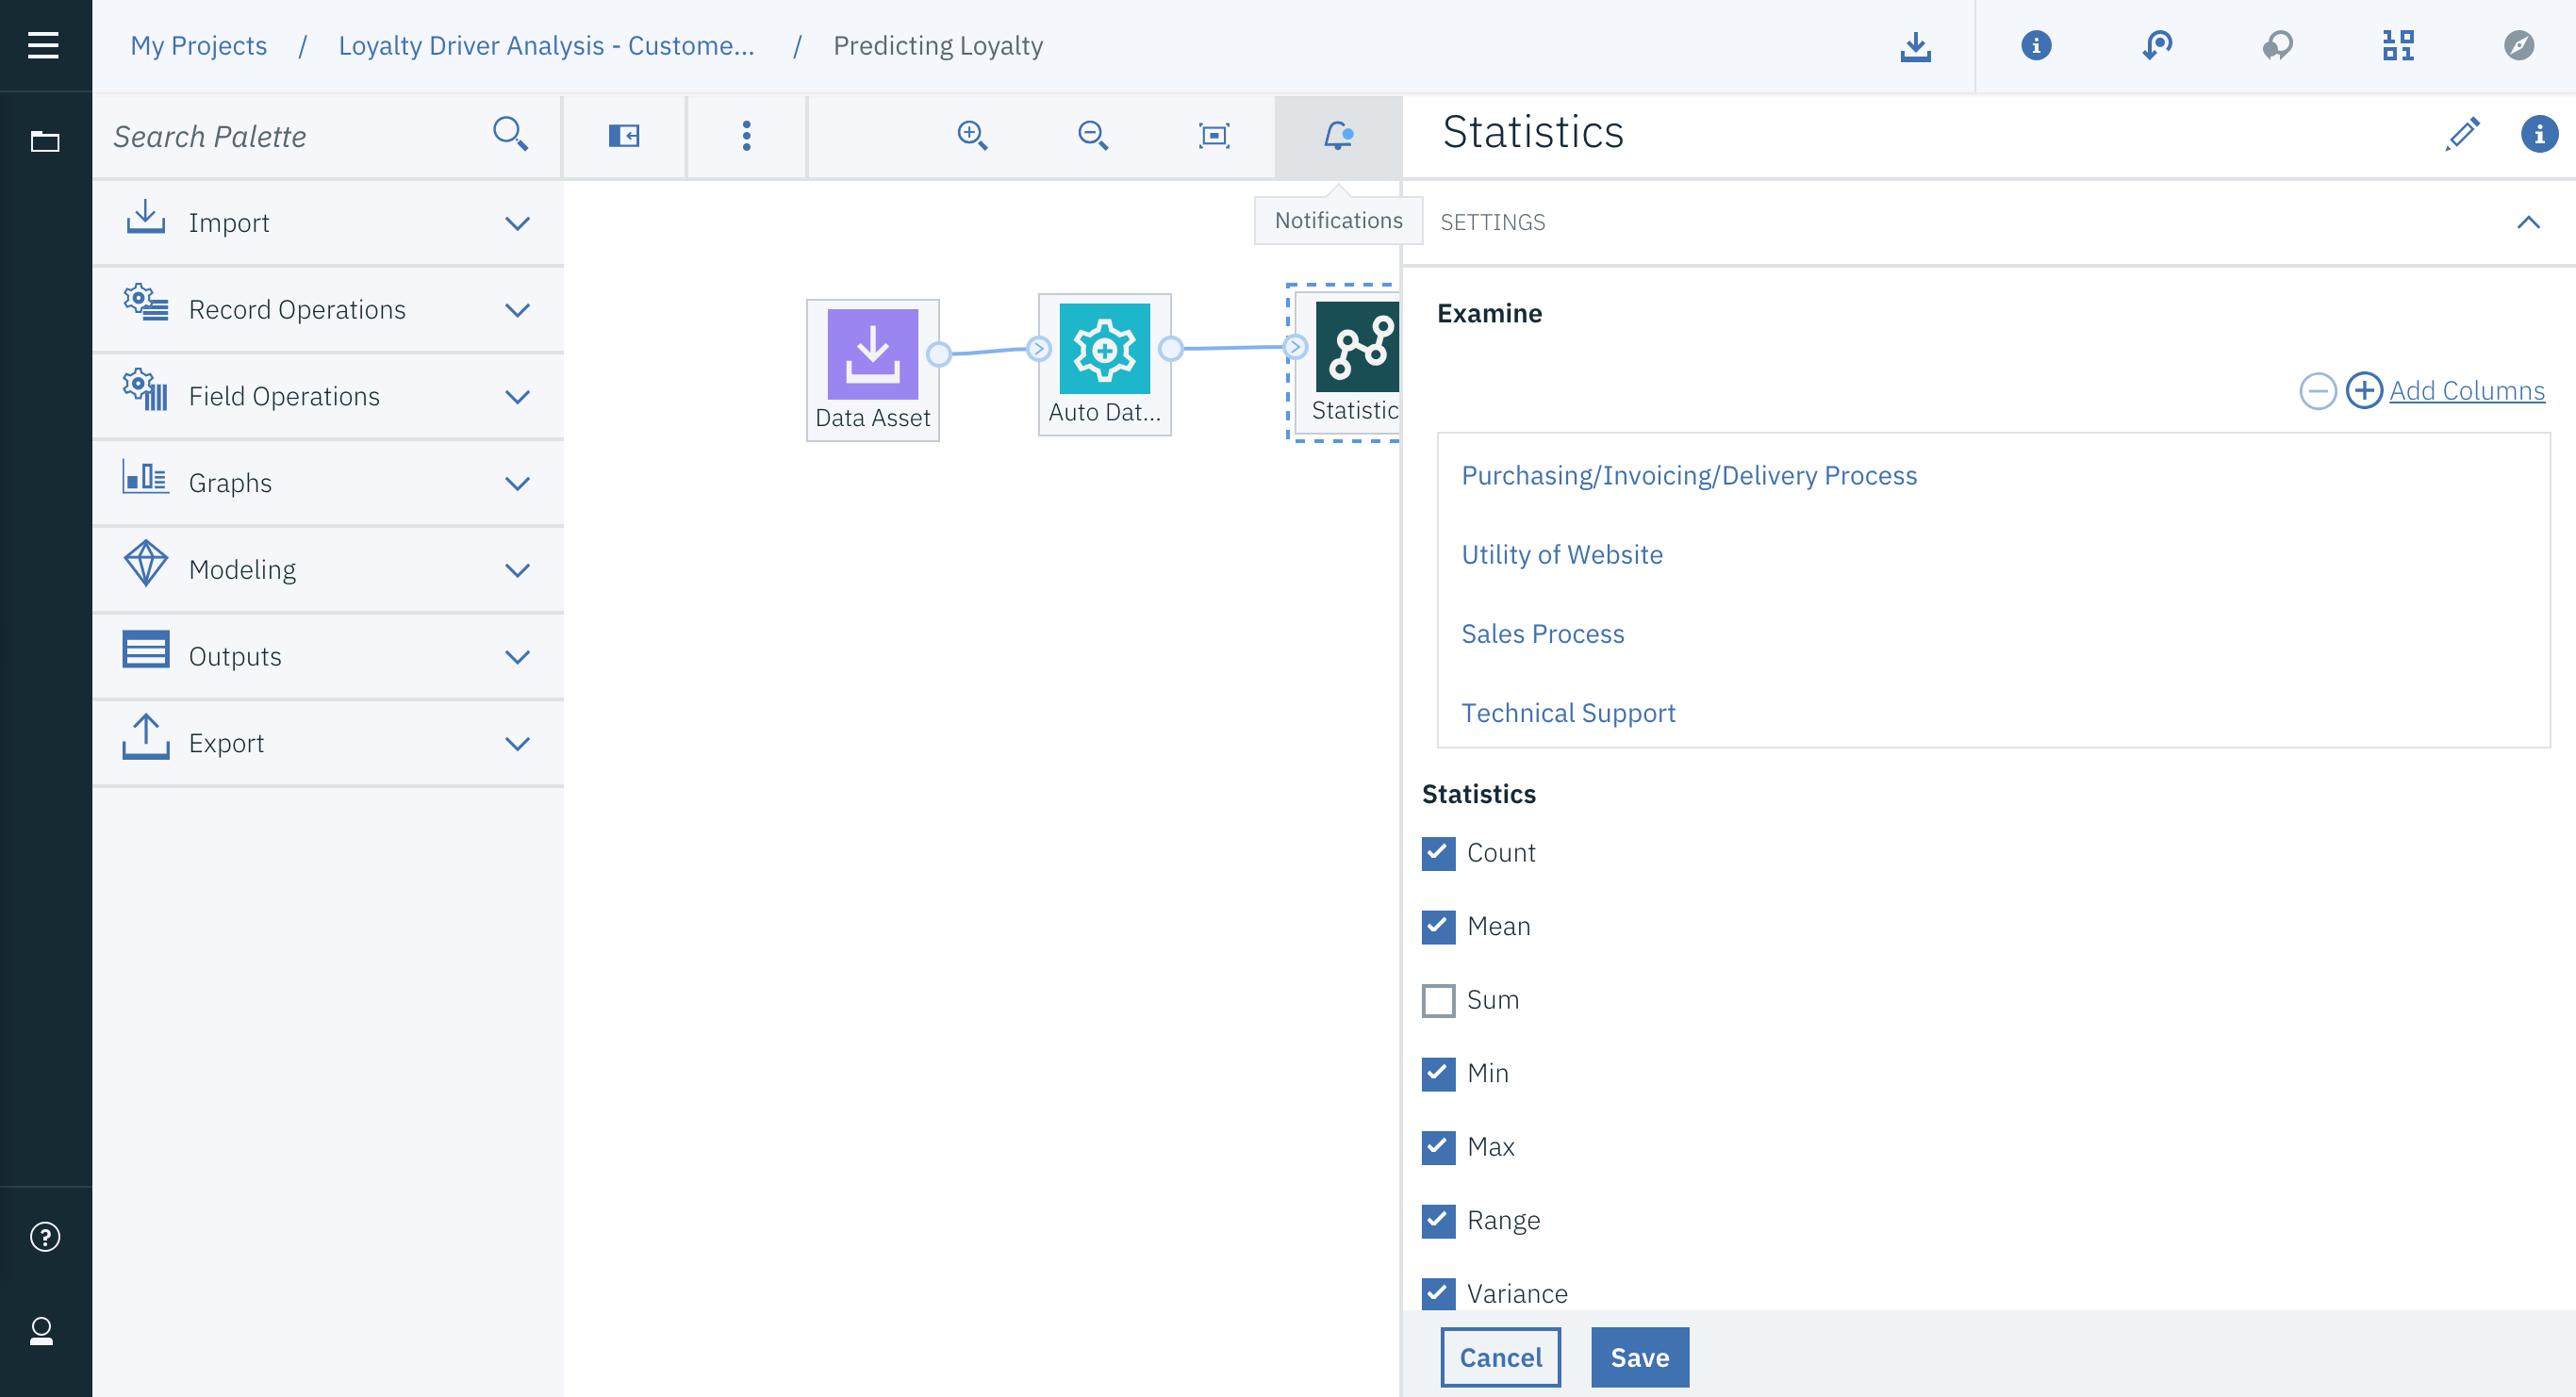
Next, we can explore our data by calculating some descriptive statistics for our measures. Simply add the Statistics Node to the window and connect it to the Auto Data Prep Node. Click on the upper right of the Statistics Node to open the window to select the variables you want to include in the analysis (Add Columns) and the statistics you want to see for those variables and click save.
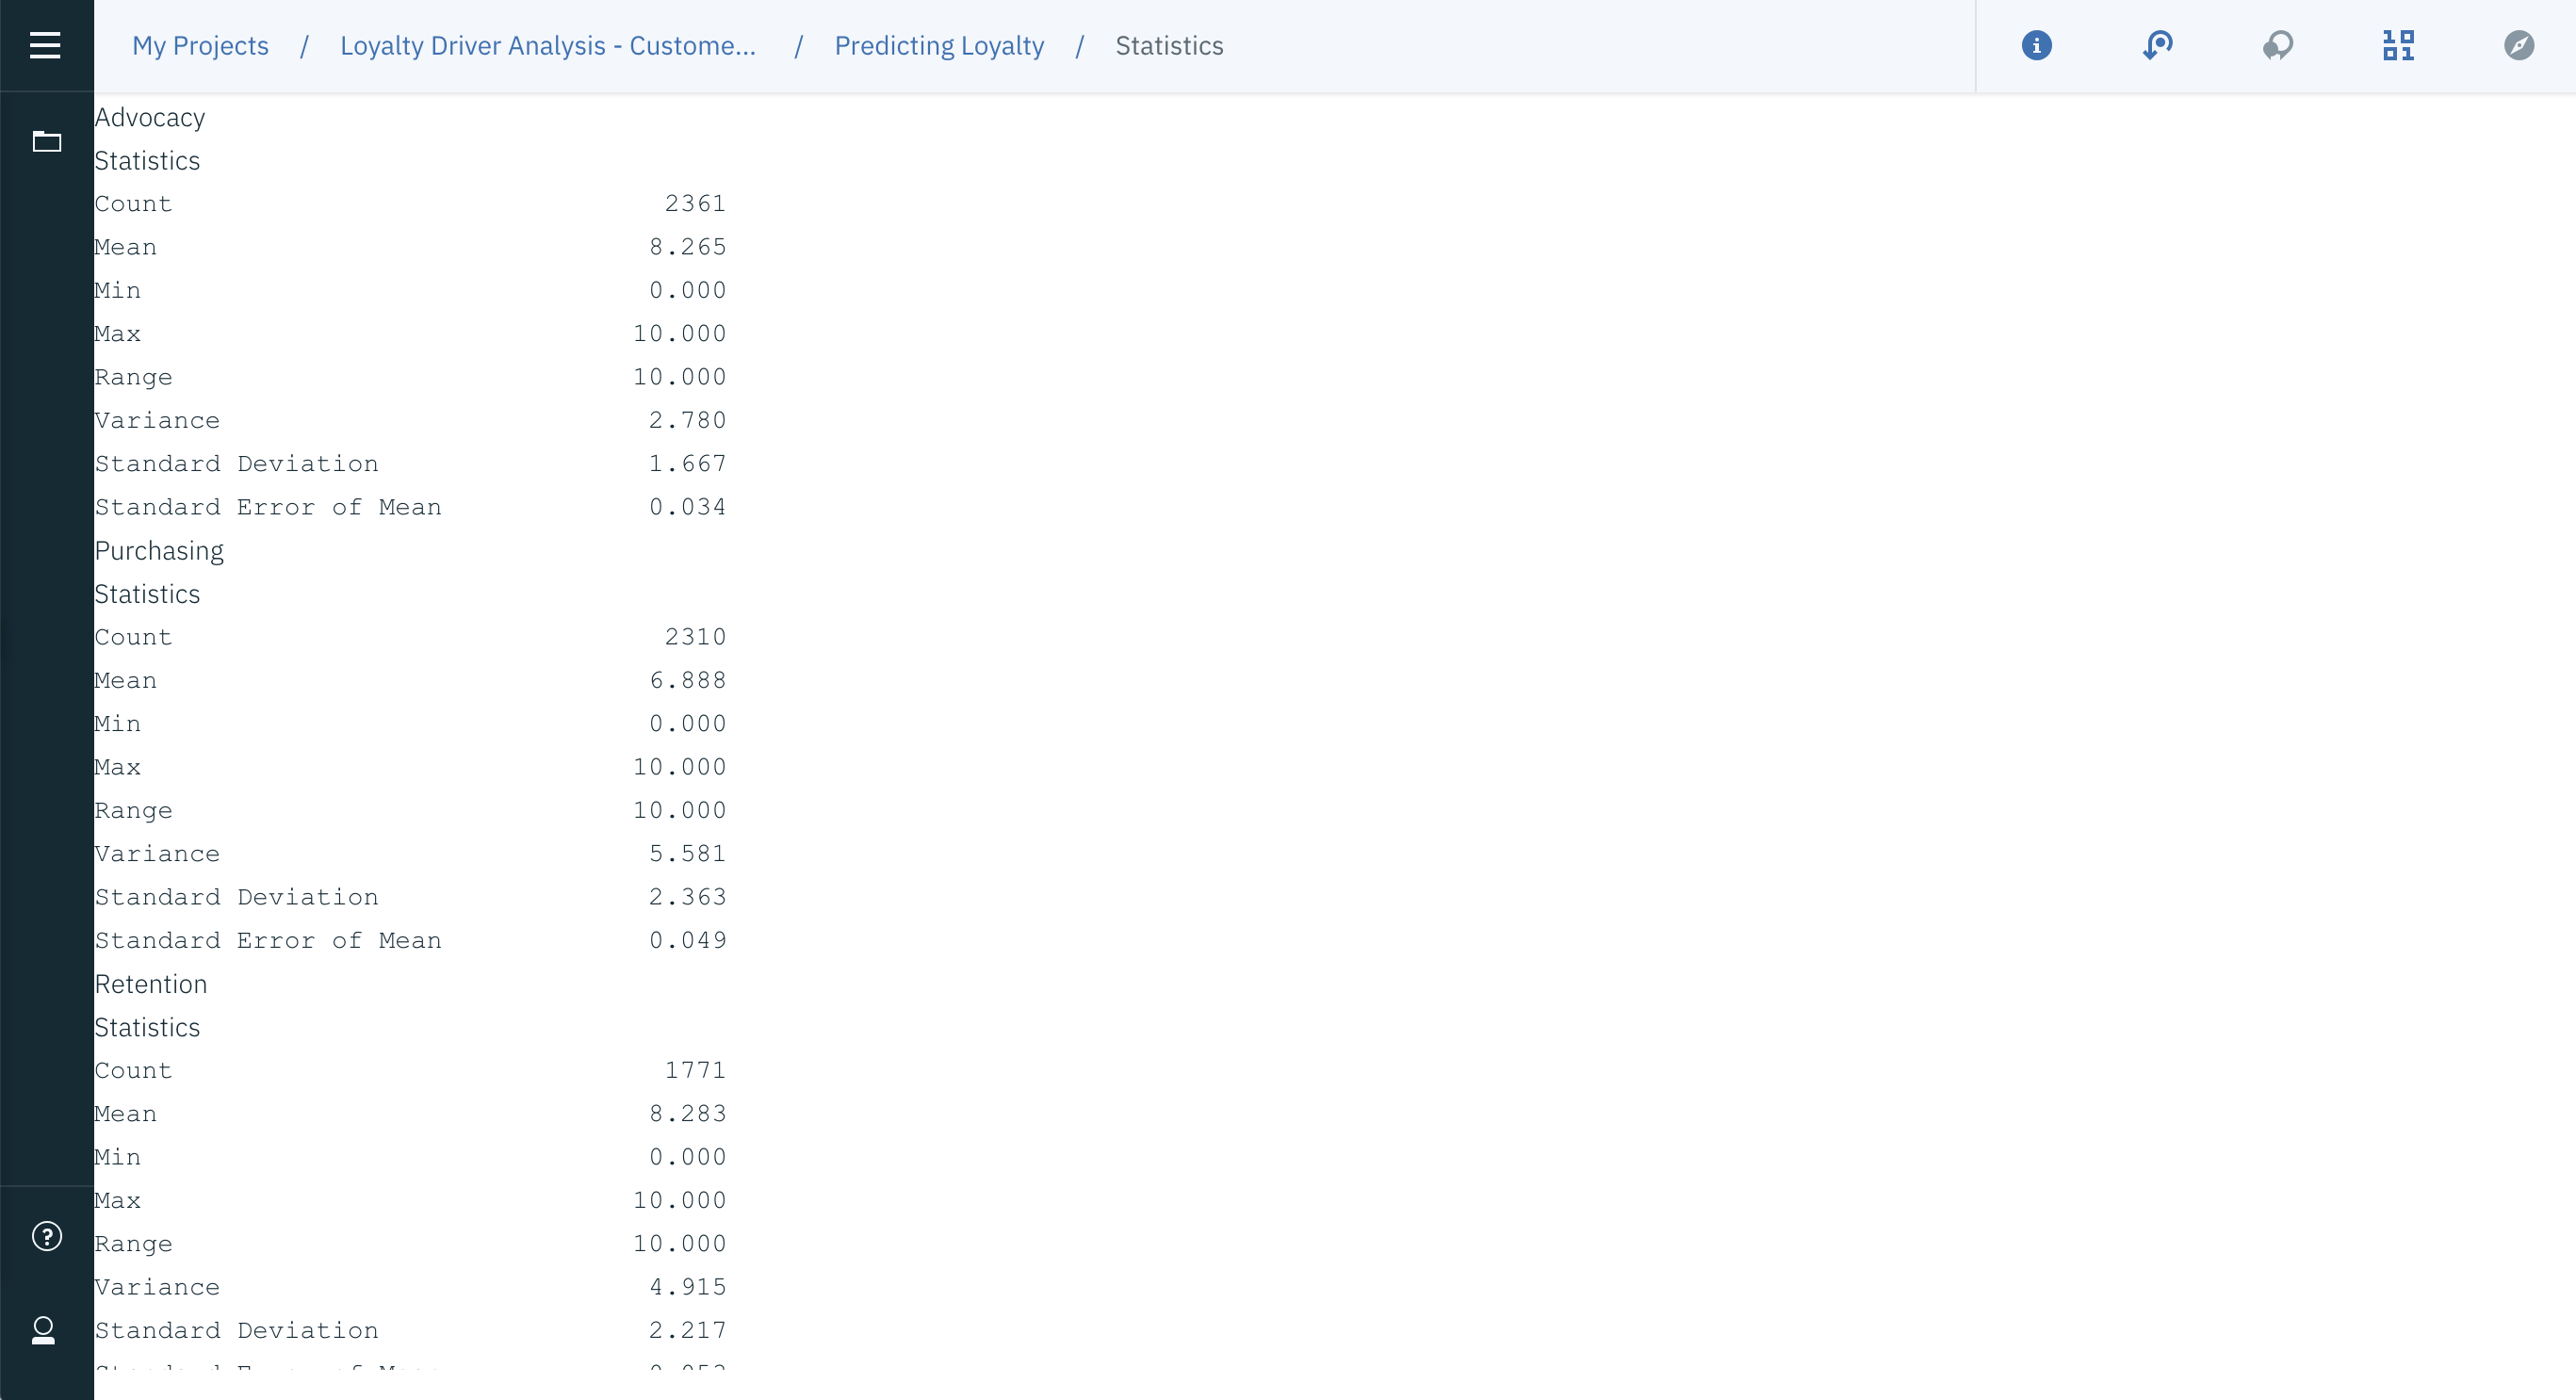
To view the statistics, click on the Statistics Node and hit run. An Output panel will open up to the right with a list of icons, each representing a particular analysis you ran. Double click the icon to view the results (see below). You can see the descriptive statistics for each of the variables selected (scroll down if necessary). You can check for outliers or invalid values to ensure your data are clean for analysis.
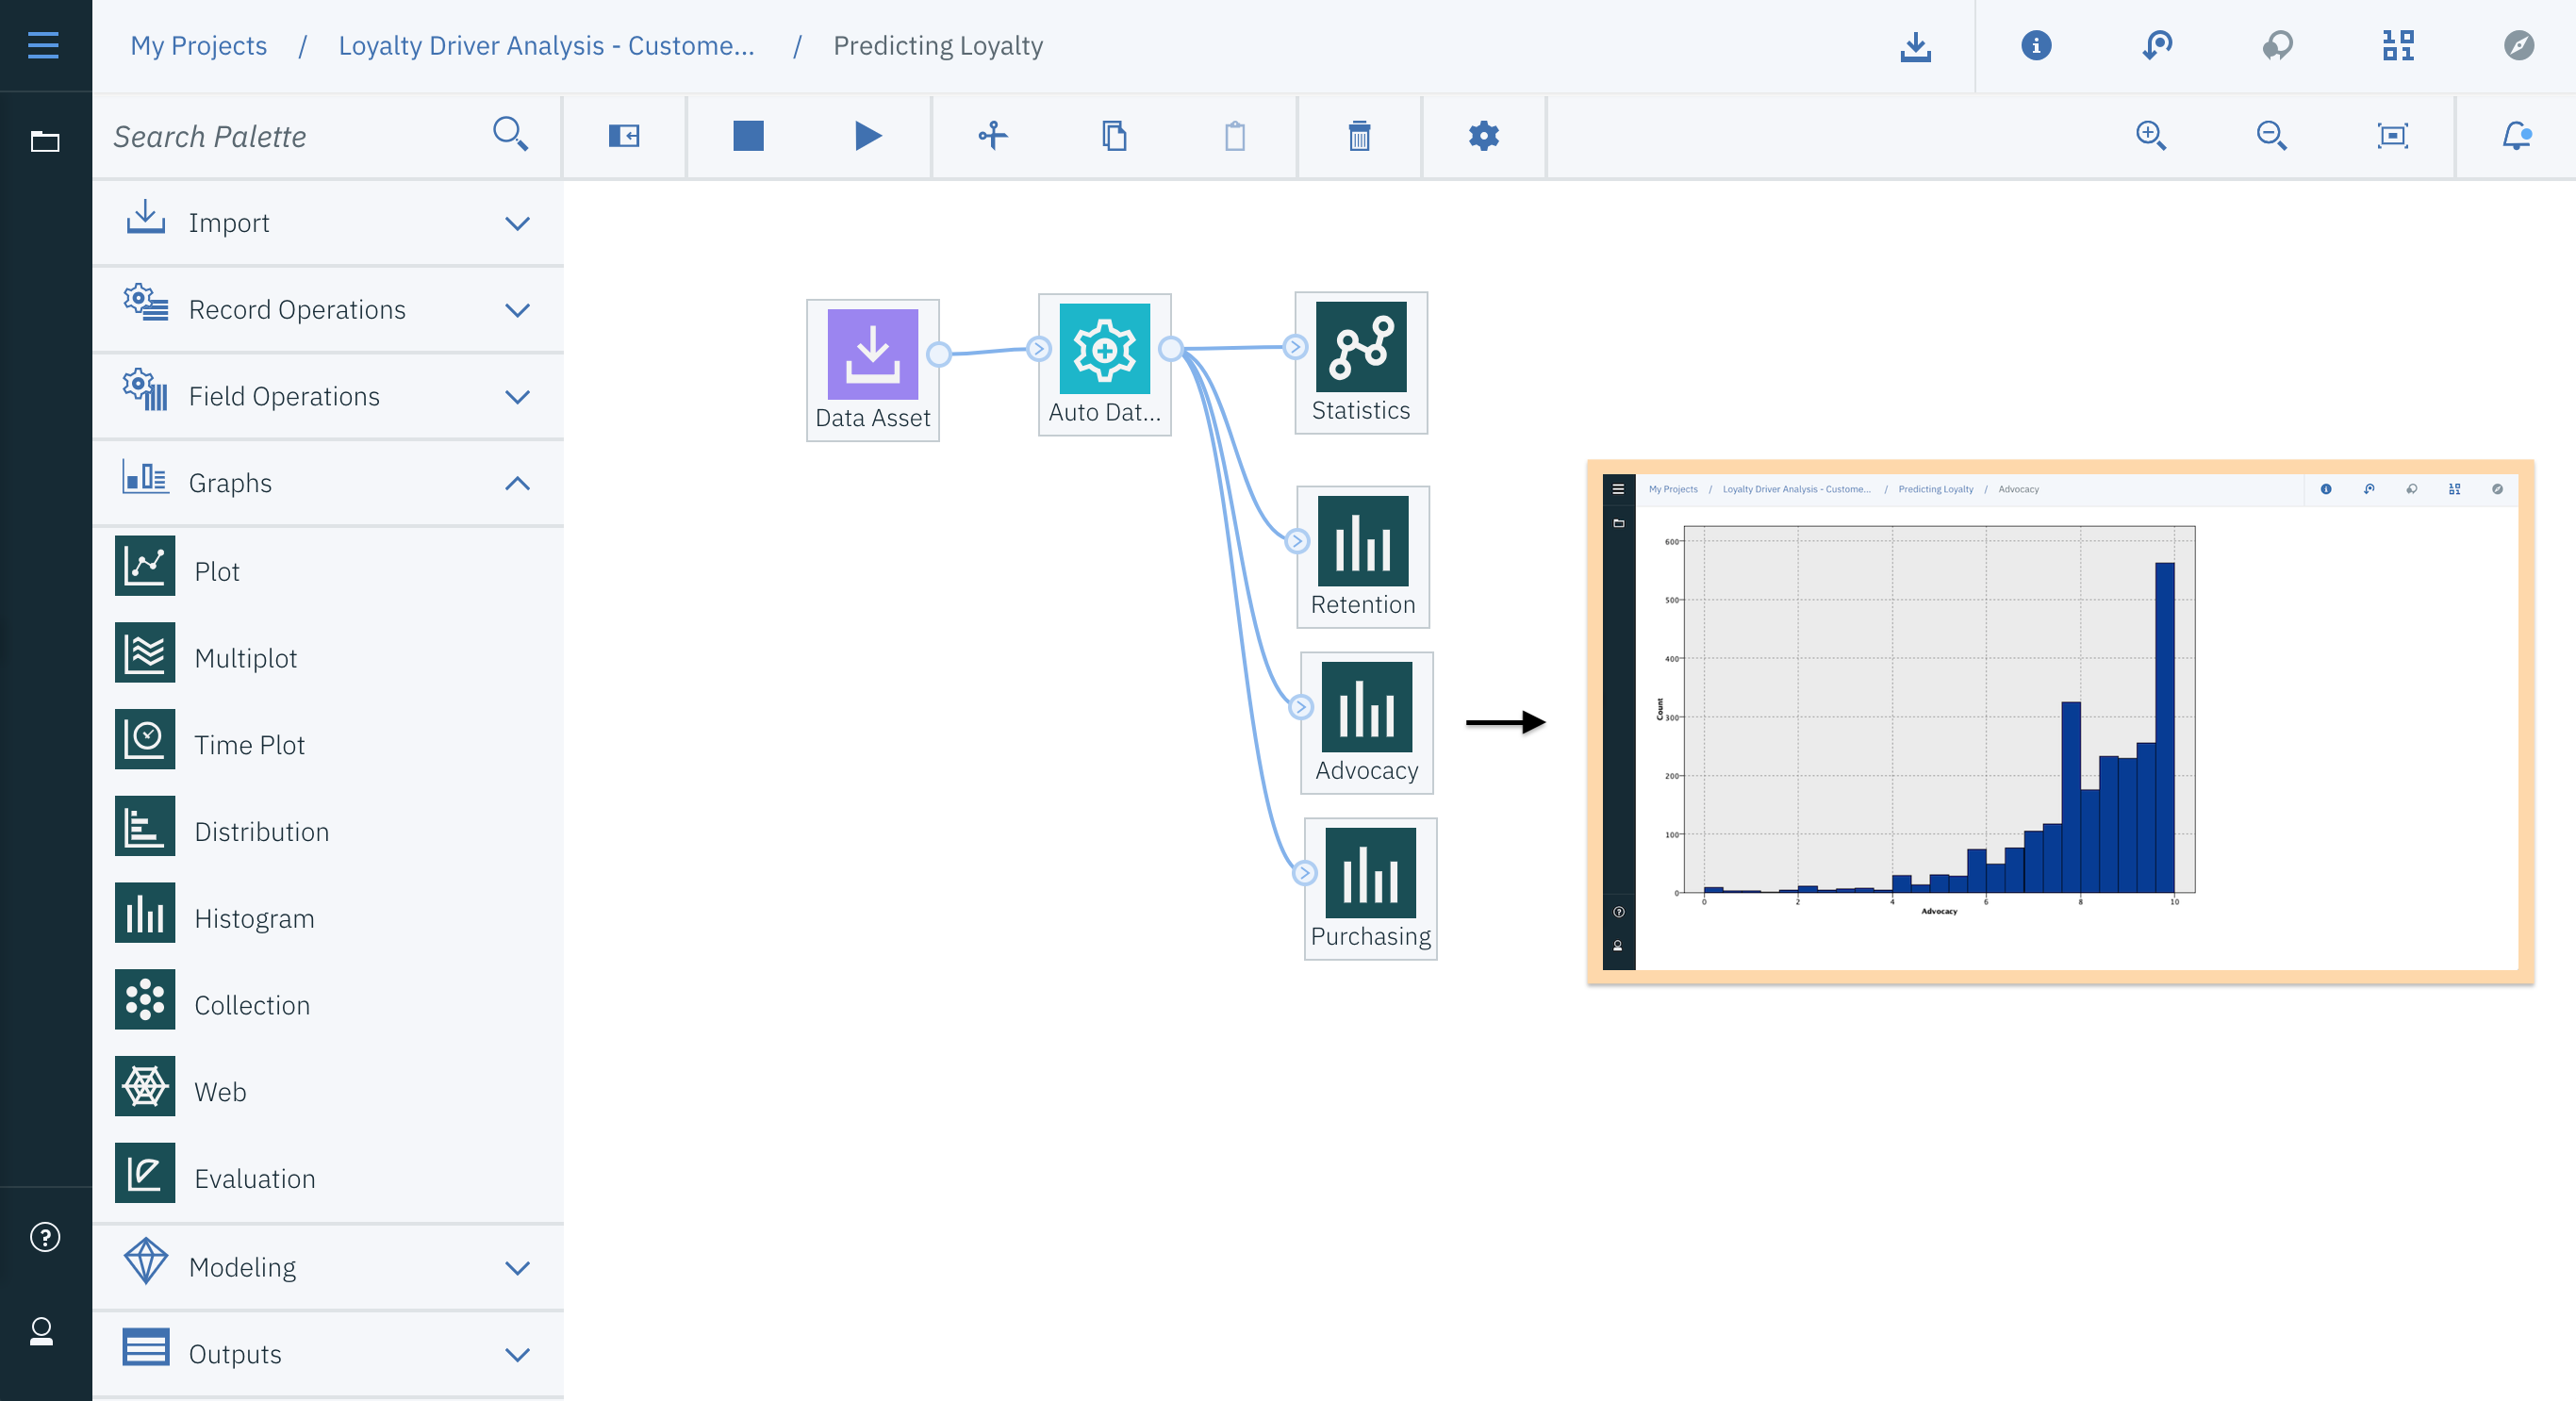
You can also view the values in graphical format. Add the Histogram Node to the Modeler Flow window. Again, attach the Histogram Node to the Auto Data Prep Node, then open the Auto Data Prep, add the variable of interest. Save then run the node. The Output panel will open up again with a new icon representing the results of the analysis. Double click the icon to view the results (see inserted picture below for Advocacy loyalty). The data look good (all variables within possible ranges (0 to 10)).
4. Analyze Data
The next step is to analyze the data. For our example, to answer our questions, we need to look at two types of analytics: 1) Descriptive and 2) Predictive. Descriptive analytics are used to indicate the current state of the world. In our case, descriptive analytics helps us know the current satisfaction level of each customer touch point and the current state of customer loyalty. The level of satisfaction is indexed by a summary statistic. While different summary statistics can be used, I use the mean score (sum of all responses divided by the number of respondents).
Predictive analytics are used to make predictions about future events. In our case, predictive analytics helps us know how strongly/weakly each of the customer touch points is related to customer loyalty. This information tells us the relative importance of each CX touch point in ensuring customers are loyal. The relationship between CX touch points and customer loyalty can be calculated by simply correlating the ratings of the touch point with the customer loyalty measure. This correlation is referred to as the “derived importance” of a particular touch point. If the survey has a measure for each of the eight (8) touch points, we will calculate eight (8) correlations for each of the measures of customer loyalty. Higher correlations (max is 1.0) indicate a strong relationship between the touch point and customer loyalty (e.g., business area is important to customers). Low correlations (near 0.o) indicate a weak relationship between the touch point and customer loyalty (e.g., business area is not important to customers). I added the three loyalty metrics to the model. Because research has shown that different types of loyalty are impacted by different types of CX touch points, I needed to build different models for each type of customer loyalty.
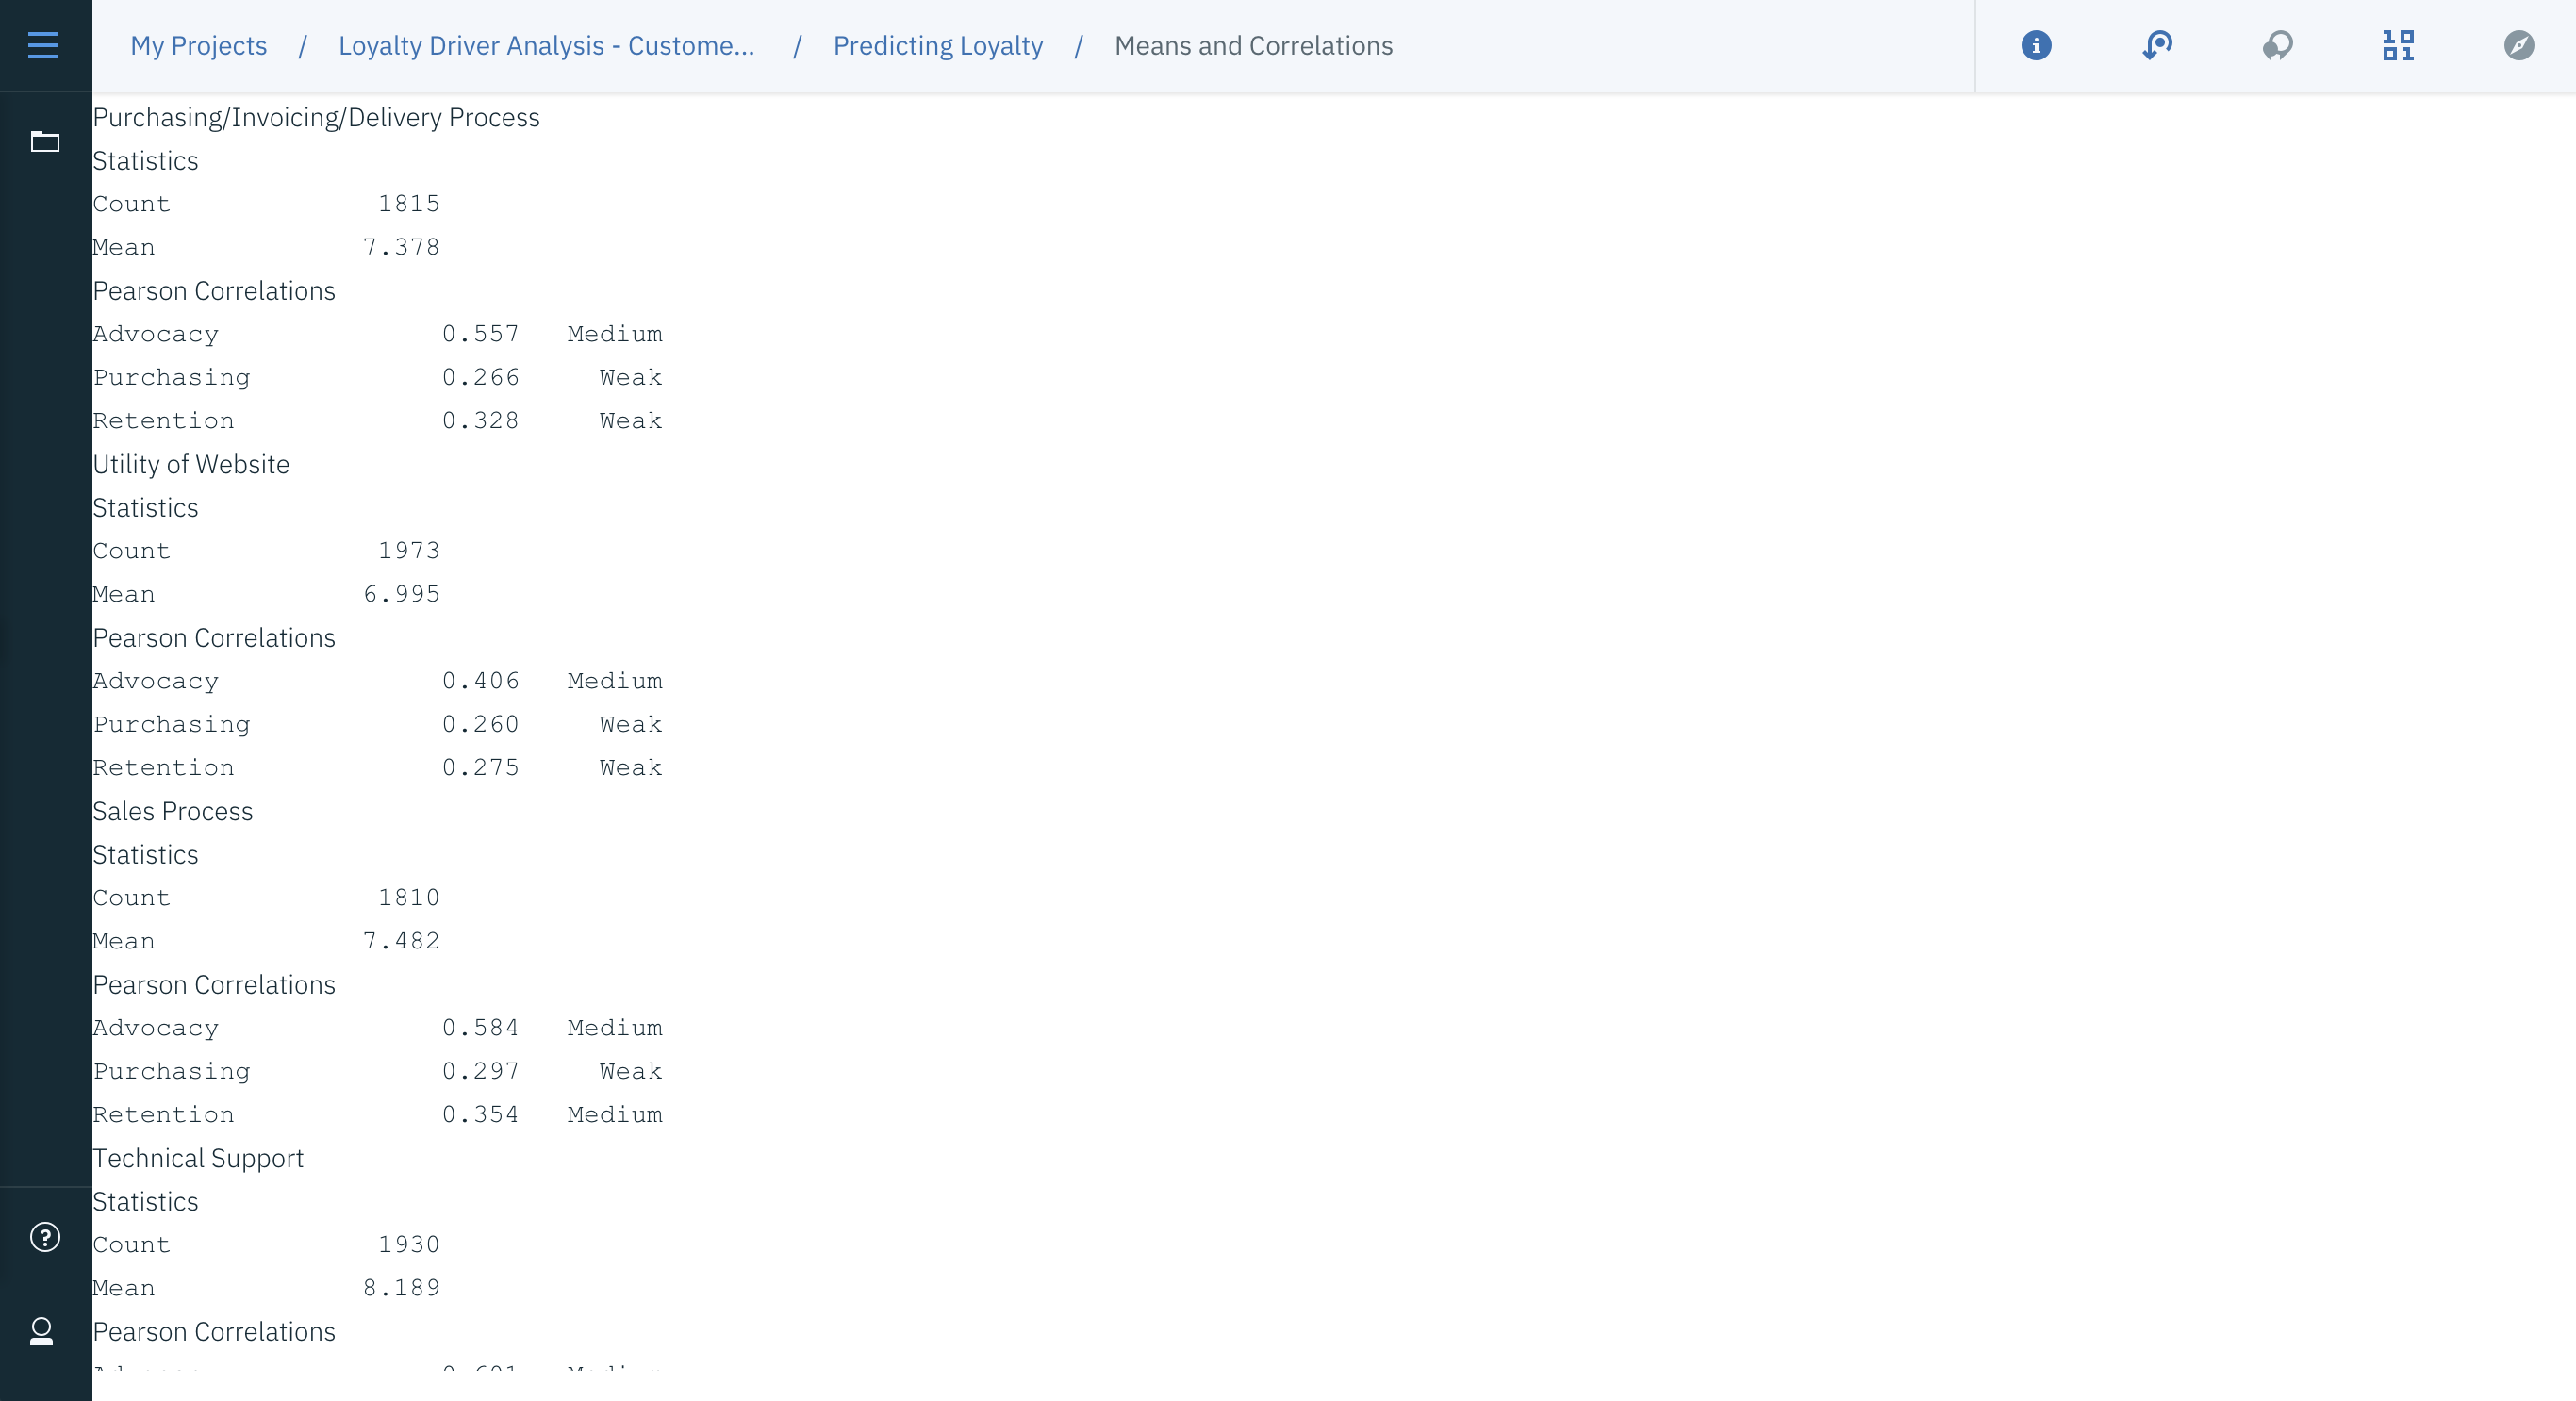
In IBM Watson Studio, I selected the Statistics Node from the Outputs options to calculate the means for each variable and their correlations with each of the three measures of customer loyalty. Double click the Statistics Node to add the 8 CX touch points (predictors). You can then check the specific descriptive statistics you are interested in examining (I added count and mean). Scroll down in that panel and you can add the three loyalty measures to which you want to correlate the eight CX touch points. Hit save. Then run the Statistics Node to view the descriptive statistics of all predictors and their correlations with each of the measures of customer loyalty. See below. You can scroll down to view the entire output.
5. Communicate Results
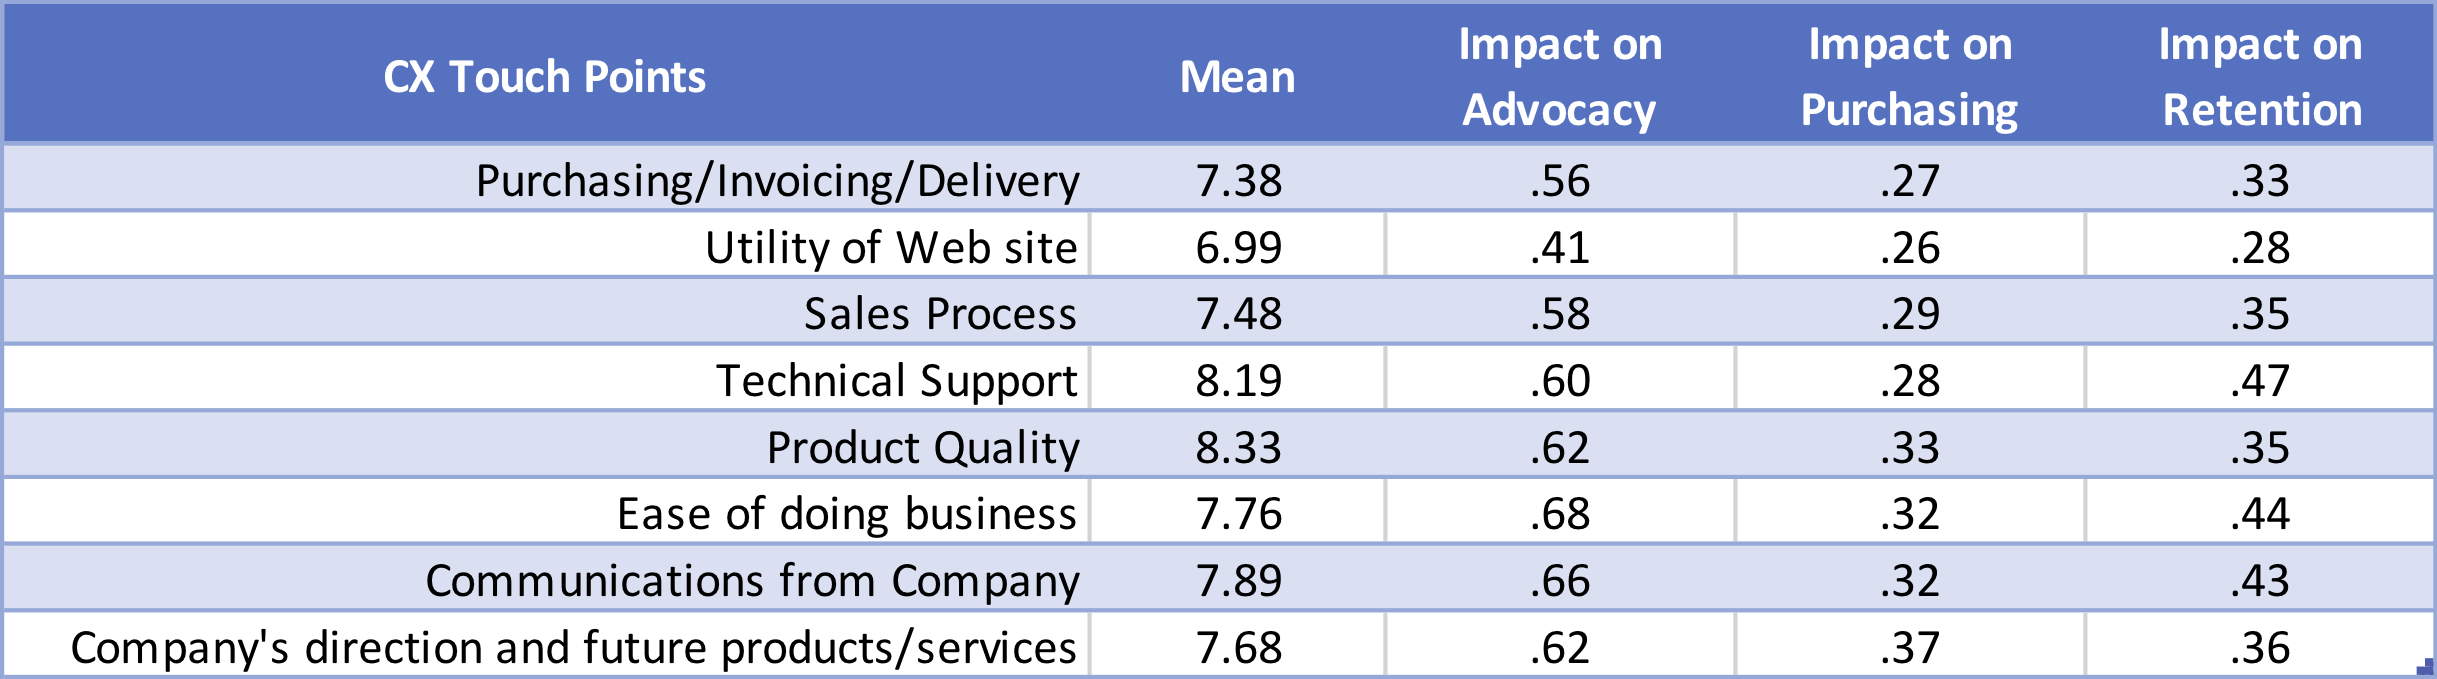
Means of CX Touch Points and Their Correlations with (Impact on) Advocacy, Purchasing and Retention Loyalty.
Now, we have the answers to our two questions: What’s the current level of satisfaction for our touch points and what are the correlations with each of the measures of loyalty. You can use the output for your reporting. I took the extra step of consolidating the results into a simple table (See Table 1).
With these data, we can draw some conclusions about the health of the customer relationship. First, from our earlier analysis in the exploratory phase, we see that the means for the three measures of loyalty are: Advocacy: 8.3; Purchasing: 6.9; and Retention: 8.3. That is, Advocacy and Retention Loyalty appear to be relatively high while Purchasing Loyalty is relatively low; this suggests that, even though the customers are more likely to recommend the company and stay with them for a long time, they are less likely to expand their relationship with the company.
Customers are most satisfied with Product Quality, Technical Support and Communications from the company. Customers are least satisfied with Utility of Web site, Purchasing/Invoicing/Delivery, Sales Process and Company’s direction and future products/services.
Second, we can identify the CX touch points that have the biggest impact on the different types of customer loyalty. The top four drivers of Advocacy Loyalty are Ease of doing business, Communications from the company, Company’s direction and future products/services and Product Quality. The top four drivers of Purchasing Loyalty are Company’s direction and future products/services, Product quality, Communications from the company and Ease of doing business. The top four drivers of Retention Loyalty are Technical Support, Ease of doing business, Communications from the company and Company’s direction and future products/services.
I noticed that, while Web site utility received the lowest ratings of satisfaction, it also has the lowest impact on customer loyalty. That is, Web site utility does not appear to be as important to driving customer loyalty compared to the other CX touch points. Improving Web site utility will do very little to improve customer loyalty.
To improve customer loyalty, this company might initially consider focusing their CX improvement efforts on those CX touch points that have a low level of satisfaction and have a large impact on customer loyalty. Based on the results, it appears that Company’s direction and future products/services could be an area where there is room for improvement and it has a relatively high impact on the three types of customer loyalty.
Summary
In this article, I illustrated how you can use IBM Watson Studio to analyze customer survey data to answer two important questions about the health of your customer relationship. In pursuing the answers, I found Watson Studio Desktop was fairly easy to use. I referenced their online documentation a few times in the process and found my answers quickly, with links to documentation and other great resources including IBM Watson Studio Community.
This post was brought to you by IBM Watson Studio. I received compensation to write this post but all opinions expressed are my own.

 Beyond the Ultimate Question
 Measuring Customer Satisfaction and Loyalty (3rd Ed.)
Comments are closed.