Apple Sales And Profits Analysis For FY 2023 — Top 10 Insights
Apple, the world’s leading manufacturer of consumer electronics devices and the most profitable company in the United States, generated total revenues of $383 billion during fiscal year (FY) 2023, which spanned 12 months ending on September 30, 2023. Following are a few highlights from our review of Apple’s FY 2023 results; we see that the company in FY 2023 reported:
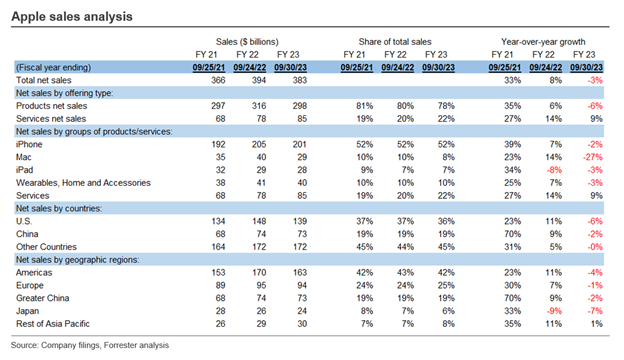
- A total revenue decline of 3% year over year (YoY).
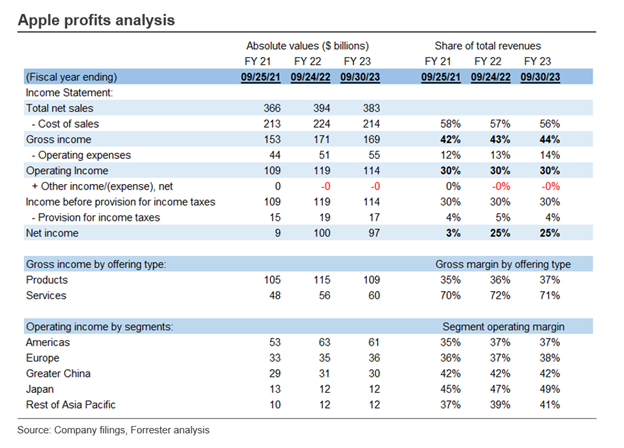
- A record gross profit margin of 44%.
- An operating income of $114 billion, with an operating profit margin of 30% (please see below for the graphic covering Apple profits analysis).
- A net profit of $97 billion, with a net profit margin of 25%.
Following are the top 10 insights from our analysis of Apple’s sales and profits across its offerings and operating segments for FY 2023:
1. Products vs. services. Apple reported $298 billion of product sales and $85 billion of services sales. Products constituted 78% of total sales, while services accounted for the remaining 22%. Apple experienced a 6% YoY decline in product sales, but services sales grew by 9% YoY (please see the graphic on Apple sales analysis below). The gross margin for products stood at 37%, while services boasted a higher gross margin of 71%.
2. iPhone. Apple reported $201 billion in sales from its iPhone lineup, accounting for 52% of total sales. Despite a slight decline of 2% YoY, iPhones remained a significant contributor to the company’s product sales. The iPhone series includes models such as iPhone 15 Pro, iPhone 15, iPhone 14, iPhone 13, and iPhone SE. Notably, iPhones constituted two-thirds of product sales, while the remaining one-third came from other Apple products.
3. Mac. Apple achieved $29 billion in sales from its Mac lineup, accounting for 8% of total sales. Mac includes Apple’s range of personal computers running on the macOS operating system, including the MacBook Air, MacBook Pro, iMac, Mac mini, Mac Studio, and Mac Pro. Mac sales experienced a decline of 27% YoY.
4. iPad. Apple recorded $28 billion in sales from its iPad lineup, experiencing a slight decline of 3% YoY. The iPad series consists of tablets running on the iPadOS operating system, including the iPad Pro, iPad Air, iPad, and iPad mini. Notably, iPad sales were only $1 billion less than the sales generated by Mac.
5. Wearables, home, and accessories. Apple generated $40 billion in sales from wearables, home, and accessories, representing 10% of total sales. Wearables include smartwatches such as Apple Watch Ultra 2, Apple Watch Series 9, and Apple Watch SE, along with wireless headphones like AirPods, AirPods Pro, AirPods Max, and Beats products. The home category comprises Apple’s digital media player (Apple TV) and wireless smart speakers (HomePod and HomePod mini), while accessories include both Apple-branded and third-party accessories.
6. Services. Apple’s services revenues have experienced consistent growth over the years. With an installed base of over 2 billion active devices and more than 1 billion paid subscriptions across the services on its platform, Apple’s services revenues are primed for even stronger growth. Apple’s services revenues have the potential to reach $100 billion in FY 2025, up from $85 billion in FY 2023, if they continue to grow by 9% in both FY 2024 and FY 2025. Apple’s service offerings include advertising services, cloud storage with iCloud, extended warranty and technical support through Apple Care, and payment options with Apple Card and Apple Pay. Apple operates the App Store platform that enables users to access a wide range of applications and digital content such as books, music, videos, games, and podcasts. Additionally, Apple provides subscription-based services like Apple Arcade, Apple Fitness+, Apple Music, Apple News+, and Apple TV+ for a comprehensive digital content experience.
Apple operates its business primarily based on geographic segments. The reportable segments of Apple include the Americas, Europe, Greater China, Japan, and the rest of Asia Pacific.
7. Americas business. Apple recorded $163 billion in sales from the Americas segment (including both North and South America), representing 42% of total sales. The US alone accounted for $139 billion in sales (36% of the total sales and 85% of Americas business). Sales declined, however, in both the Americas segment (4% YoY) and the US (6% YoY). This decline represents a mix of lower net sales of iPhones and Macs and higher net sales of services. The Americas segment achieved an operating income of $61 billion, with an operating margin of 37%.
8. Europe business. Apple reported $94 billion in sales from the Europe segment (which includes European countries, India, the Middle East, and Africa), representing 25% of total sales. In the Europe segment, sales declined 1% YoY and achieved an operating income of $36 billion, with an operating margin of 38%.
9. Greater China business. Apple generated $73 billion in sales from the greater China segment (which includes mainland China, Hong Kong, and Taiwan), accounting for 19% of total sales. Other than the US, China is the only country that consistently contributed more than 10% to Apple’s net sales across 2023, 2022, and 2021. Greater China segment sales declined 2% YoY and achieved an operating income of $30 billion, with an operating margin of 42%.
10. Japan and rest of Asia Pacific business. Apple generated $24 billion in sales from Japan (or 6% of total sales), a decline of 7% YoY. Notably, Japan boasted the highest operating margin, 49%, among all segments. The rest of the Asia Pacific segment (which includes Australia and other Asian countries not covered by the other reportable segments) generated $30 billion in sales (or 8% of total sales), an increase by 1% YoY, and an operating margin of 41% in FY 2023.
Apple holds the distinction of being the largest global direct-to-consumer (DTC) company. In our 2023 Retail Competition Tracker, US research, we offer comprehensive insights on US total retail sales, e-commerce sales, offline retail sales, retail operating margins, retail selling space, and sales per square foot for 65 US retailers and DTC companies, including Apple. If you are a Forrester client, we invite you to schedule a guidance session or inquiry with Cindy Liu and me to discuss our latest findings.