Part 2: Using Data from Reports to Improve B2B Customer Support
In Part 1 of this blog series on how to use reports from your B2B customer support software solution to interpret key data and implement strategies as a result. Next, we explore how to use reporting and customer experience data to determine how happy your customers are and what to do if they’re not.
Why? When B2B companies were asked to state the single most exciting opportunity for 2020, the number one response was customer experience (or CX), beating content marketing, video marketing and social!* That’s according to the Annual Digital Trends report by Econsultancy and Adobe.
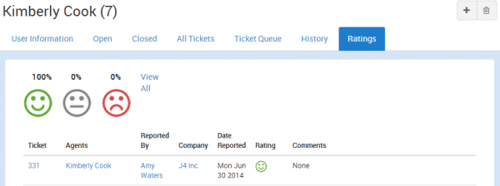
Agent Ratings: So, how are we doing? It’s a simple question asked by virtually every business that 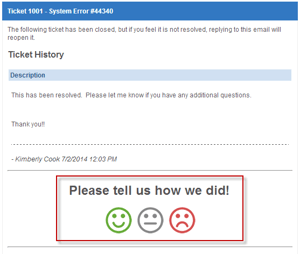 interacts with customers and how it’s answered can provide more information than you may think. Agent Ratings tools invite your customers to provide immediate feedback on their level of satisfaction at the conclusion of their interaction with your support team.
As a result, you and your team can use the data to
- Address negative responses swiftly, before the customer spreads the word through review sites or within the client company.
- Track trends and service issues to get to the root cause and identifying areas where more training or coaching is needed.
NPS Scores: The NPS (Net Promoter Score) is a measure of a customer’s overall opinion on a company. Established by Bain & Company in 2003, it’s based on the response to a simple but powerful question, “How likely are you to recommend us to a friend or colleague?” and uses a 0 to 10 scale (with 10 being “extremely likely”). Based on the customer’s response, they are assigned a label. “Detractors” responded with a score in the 0-6 range, “Passives” in the 7-8 range, and “Promoters" in the 9-10 range.

When analyzing results from NPS responses, pay attention to the percentage of Detractors—they are in danger of churn. Compare this metric to other reporting metrics, such as minutes to initial response and number of tickets that have to be reopened, to determine the “why” behind the low scores.
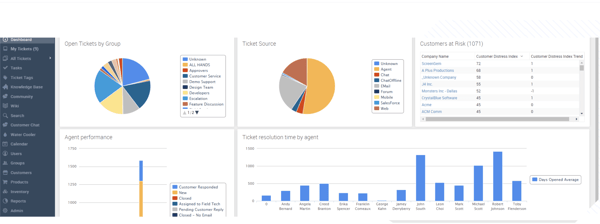
CDI™: Proprietary to TeamSupport, the Customer Distress Index (or CDI) provides a 0-100 score indicating how happy a customer may be with your business. This score can be customized by providing weights to specific values. For example, if ticket resolution time is of high importance to your customers, you can weigh this more strongly than total number of tickets or another value. This score can be a great asset in building and maintaining positive customer relationships.
It’s one of the most valuable reports you can run as it lets customer service teams monitor customer satisfaction and measure overall customer health in order to be more proactive in mitigating the risk of churn.
Using these reports in conjunction effectively allows you to improve the customer experience, coach and develop your agents, and mitigate the risk of churn.
We conclude this series with Part 3 where we walk you through using reports to analyze trends and make more strategic business decisions.
*Experience Index: 2020 Digital Trends, 2019. Econsultancy and Adobe.


