 XM Knowledge Base
Author: Adam Bunker
Subject Matter Expert: Dave Pabley
What are customer experience metrics?
The many nuanced facets of the overall customer experience can’t be measured precisely, but keeping track of the factors related to it gives us a good proxy by which we can identify needed improvements and measure the value of those improvements.
Customer experience metrics are just that – measurable indicators of a good, or bad, customer experience. And whilst CX measurement is not the goal (but CX management is), it can, and should, be used to gauge the improvements you make to the experience over time.
Because customer experience is complex, it’s a good idea to keep track of a variety of metrics in order to make sense of its different dimensions. In this article, we’ll round up the key CX metrics you need to know about.
Customer experience metrics versus customer metrics
While the two terms are often used interchangeably, there’s a slight difference in that customer metrics can be more operational or demographic in nature.
So while customer experience metrics focus on tracking the positives and negatives of what it’s like to be one of your customers, customer metrics can cover anything from your number of active customers to details about their location, age group, or customer lifetime value.
Both sets of metrics are important to track for different reasons, but when it comes to improving the overall customer experience, you’ll want to keep a sharp focus on the experiential metrics we’ll be covering in this guide – and how those relate to or impact customer metrics.
Download the 2024 Global Consumer Trends Report today
What are the key customer experience metrics to track?
There are a number of important metrics to keep tabs on if you want to improve the customer experience.
Exactly which ones you focus on will depend on your business goals, but in general, the following seven metrics will provide a strong indication of what it’s really like to be one of your customers – and in many cases show you where CX weaknesses are:
1. Net promoter score (NPS)
2. Customer satisfaction (CSAT)
3. Customer effort score (CES)
4. Customer sentiment
5. Customer emotional intensity
Net promoter score (NPS®)
Want to know how loyal your customers are and how likely they are to recommend you and buy from you in future? The Net Promoter Score measures customer loyalty based on one simple survey question: ‘How likely is it that you would recommend [Organization X/Product Y/Service Z] to a friend or colleague?’
Respondents give a rating between 0 (not at all likely) and 10 (extremely likely). You then remove the neutral responses and subtract the percentage of Detractors, from the percentage of Promoters to give your Net Promoter Score.
Net Promoter Score is the most common customer experience measurement – it’s easy to understand, quick to complete and gives a big-picture customer loyalty gauge.
See what happens when you improve your Net Promoter Score (NPS) with the simulation below.
Customer satisfaction score (CSAT)
If you’re measuring CX, it makes sense to know how satisfied your customers are with your products or services. CSAT measures customer satisfaction based on a question: ‘How would you rate your overall satisfaction with the [goods/service] you received?’ Respondents use a rating scale between 1 (very unsatisfied) to 5 (very satisfied).
The two highest ratings (4 and 5 on the scale, often referred to as “top 2 box”) are used to calculate a percentage score: 100% being total customer satisfaction and 0% total customer dissatisfaction. CSAT evolved from market research surveys. It’s easy to understand, simple to use, and can be rich in insight.
Want to effortlessly launch a project to measure CSAT? Download our free template now
According to McKinsey, the benefits of measuring, and improving CSAT in the customer journey are clear for your business.
Customer effort score (CES)
You’ll want your customers to be able to interact with you as effortlessly as possible. Customer effort score (CES) asks a question like: ‘How easy was it to deal with our company today?’ giving simple options: Easy, Neither, Difficult. Subtract the percentage of ‘Difficult’ respondents from the ‘Easy’ ones to give the overall customer effort score.
Customer effort score is relatively new compared to NPS or CSAT, but it’s easy to understand and use – and it often supplies actionable data so you can change things quickly.
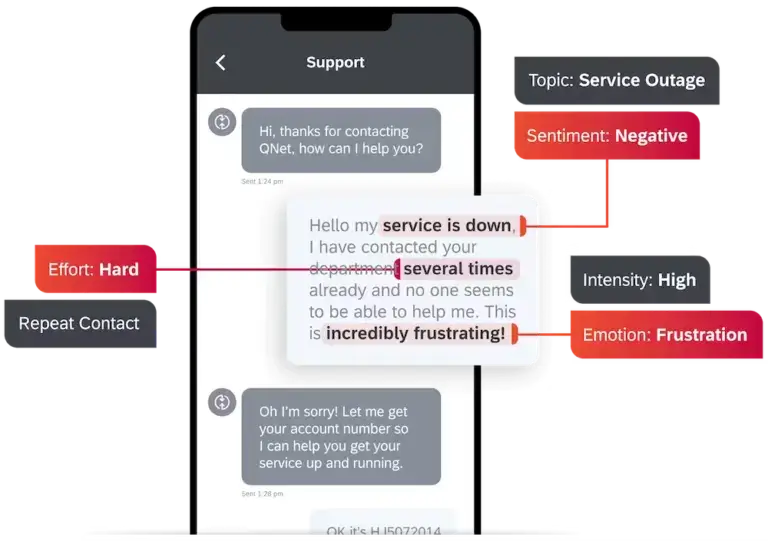
The Qualtrics® XM® Discover platform, for instance, automatically calculates an Effort Score based on the language your customers use – like in survey verbatims or call or chat interactions (for example: “It took me forever to find the right link…”). This saves you the time of having to ask the CES question in your surveys.
All told, tracking and working to decrease the amount of effort your customers are exerting is a powerful way to help impact positive reviews on the business.
Customer sentiment
Customer sentiment tracks how people feel about your business, dividing things into positive, negative, or neutral. The more positive their sentiment, the more likely they are to recommend your brand – and buy from you again.
Sentiment is usually measured by analyzing data from customer surveys, reviews, social media, and call transcripts. Sentiment analysis tools use natural language processing to categorize this unstructured data, providing insights into how customers perceive their experiences, and where there are problems or opportunities to improve.
Because of this, customer sentiment is a key indicator of customer satisfaction and loyalty; monitoring changes in sentiment over time will help you evaluate the impact of changes to your products, services, and marketing.
Customer emotional intensity
Emotional intensity is another metric that makes use of natural language processing to add a layer of qualitative data to your CX insights. It’s calculated on a 1 to 5 scale denoting effort, which in turn fits into three segments: Low (1), Medium (2-3), and High (4-5).
Tracking emotional intensity can help you understand how a customer feels about their experiences with your brand, and how intense those feelings are. The insights you’ll glean from this include:
- Highlighting leading indicators of customer loyalty
- Determining areas of customer passion
- Monitoring reactions to launches, announcements, or current events
- Tracking polarizing topics
- Designing emotionally appropriate engagement
- Identifying difficult or confusing aspects of customer interactions
Other customer experience metrics
The list above provides some overall measures of customer satisfaction/sentiment/ease, but defining other more granular metrics allows you to dive deep into the areas that matter most for your business or where you can have the biggest impact. You might choose:
- Retention loyalty – how likely are you to remain with us?
- Purchase loyalty – how likely are you to continue buying from us?
- Meeting expectations – how much better (or worse) was your experience compared to your expectation?
Questions like these can be added into your customer feedback surveys to help gauge and improve the customer experience for your business.
As well as feedback from your customers, you can also include operational data – things like website analytics, sales figures, customer demographic data, and employee HR data – to make more links between what customers do and how they feel. Essentially, the more data points you have, the more opportunities you have to identify what works, what doesn’t and what you need to focus on to improve.
How do you choose which metrics to track?
As you can see, there are plenty of metrics out there and you could spend a lot of time watching them all. However, the choice of metrics is not as important as you might think – companies will not succeed or fail based on the metrics they choose but rather on the improvements they choose to invest in based on what they learn from their customers.
Driving improvement is what’s important – and the metrics you choose are simply that, a score you can track to monitor your improvements.
With that in mind, choose metrics based on what you’ll be able to do with the data they provide. Are the results going to enable you to take action? If not, don’t spend time on them.
What are the most important KPIs for customer experience?
Metrics by themselves are just raw numbers; when you tie those numbers to your overarching business strategy and desired business outcomes, they become Key Performance Indicators (KPIs).
The operative word here is ‘performance’, and what matters here is the context: when you’re tracking KPIs, you’re doing so to try and improve things over time, which means measuring frequently, spotting trends, and finding ways to make positive changes in response to the metrics in your data set.
In other words: if you’re looking to improve the customer experience, then metrics by themselves are a fairly blunt instrument. KPIs, on the other hand, are blueprints for better.
So which are the most important KPIs for customer experience? The three most widely-accepted priorities are CSAT, NPS, and CES:
- CSAT: An ironclad indicator that customers had a good or bad experience
- NPS: Demonstrates not only loyalty but also your brand’s reputational value.
- CES: High effort is a top indicator that there are pain points in the customer journey
That’s not to say that the other metrics we’ve listed in this article aren’t important – just that these three are strong enough to give you a robust view of the customer experience as a whole.
How do you measure customer experience metrics?
Measuring customer experience metrics relies on gathering a mix of solicited and unsolicited (i.e., direct and indirect feedback) as well as both structured and unstructured sources – using a range of different tools and methods:
Surveys
Surveys are the most tried and tested method for feedback – especially for customer satisfaction (CSAT) and Net Promoter Score (NPS). While it can be difficult to get people to respond to them, they’ll provide a wealth of direct information that can help you make positive changes to the overall customer experience, especially if you include open-ended verbatim options for respondents. Survey software can help you intelligently distribute surveys for maximum responses, then collate answers and identify trends.
Contact Center interactions and CX platforms
Digital CX management platforms – like that offered by Qualtrics – aim to bring all the various touchpoints that make up the customer experience together. They can help you understand what customers think and feel, as well as why, using a mix of direct feedback, natural language processing, and AI-powered analytics. That includes automatically scanning and scoring customer messages, survey responses, social media posts, customer support calls, and emails for sentiment, effort, intent, and emotion.
Social listening
Your customers are talking about your brand all over the web – are you listening? Social channels and third-party review sites are a goldmine for customer experience insights, the key is to use digital tools that can be everywhere at once, gather disparate data points, and then wrap up findings into actionable insights.
What to look for in customer experience KPI dashboards?
The right software can make the act of gathering, comparing, and tracking improvement in your customer experience metrics simple. But there are a few key things to look out for in your chosen tool.
No matter what your goals, it’s wise to pick a software suite that has these four core capabilities:
1. The ability to bring everything together
If you want to measure customer experience in a truly comprehensive way, look for a platform that can connect and consolidate all your experience and customer data sources – surveys, phone calls, chats, emails, CRM records, support tickets, analytics, social media, and more – into a unified view.
This will give you a complete picture of the customer journey across every touchpoint, and help to identify correlations and pain points. Disparate metrics lead to a fuzzy overall picture and the chance that you’ll miss glaring issues that more integrated software can easily flag.
2. The ability to turn data into insights
Metrics by themselves can be fairly useless if you don’t have an army of data scientists to hand. Powerful CX software in this space can do a lot of the heavy lifting for you here, by scouring datasets and helping to turn all those various metrics into actionable information across the customer journey.

Advanced dashboards, visualizations, predictive analytics, driver analyses, and AI should help you glean powerful insights from your customer data. The ideal tool will automatically spot trends, identify their key drivers, and clearly communicate insights to the people who can best use them.
3. Real-time monitoring
You’ll want to opt for a customer experience metrics and KPIs solution that allows you to monitor customer experience KPIs and sentiment metrics in real-time – and across every channel. This enables you to detect issues immediately, trigger alerts, and take corrective actions to minimize negative impacts.
There’s always a danger that unnoticed pain points in the customer journey can spiral into reputational damage. Real-time insights can help mitigate that, as well as move your CX efforts on from an outdated model of taking sporadic, fast-outdated snapshots.
4. Artificial intelligence
In most cases, the capabilities listed so far will mean choosing a tool imbued with AI, machine learning, and natural language processing. That’s principally because AI can do what people can’t – monitor untold sources of information in an instant, and surface a much more comprehensive set of insights.
Natural language processing means that every customer interaction can be scored and automatically added to your datasets, while machine learning algorithms will constantly learn about your customer’s behavior, preferences, and trends – building an airtight, up-to-the-minute picture of your business’s customer experience performance.
The next step? Taking action
The most valuable metrics are actionable ones. For example, if you measure average response time, you can understand what may be driving undesired changes in that metric (the “what”) by understanding the CX metrics related to that channel, such as sentiment, effort, and emotion (the “why”). Then you can take action by improving staffing levels or software resources in your contact center, revising your ticketing system or offering better training to your people. This level of activity can be measured through customer experience KPI’s.
Your CX metrics should form part of a system of action (and not just a system of measurement), pointing the way towards the steps you’ll take to improve CX in your business. And, when you do take action, make sure your customers are aware that the improvements you make are as a result of their experiences and their feedback. That’s where real customer relationships and lasting loyalty are built.
And it’s here where Qualtrics shines. Our Customer Experience Management Platform® has been designed to help brands deliver best in class CX through constant insight gathering across every touchpoint and channel.
With Qualtrics, you’ll easily be able to bring together experience data, behavioral heuristics, and journey optimization to eliminate guesswork. Click here to learn more.
Discover 2024’s biggest consumer trends
There are four big insights driving customer experience wins and losses this year. Does your team know what they are?
We surveyed over 28,000 customers from 26 countries to hone in on the factors that can make or break the customer journey, and distilled them into 2024’s Global Consumer Trends Report. Click the link below to download your free copy.
NPS® is a registered trademark of Bain & Company, Inc.
Free eBook: 2024 Global Consumer Trends Report