
Calculating your Net Promoter score is as simple as subtracting the % of Detractors from the % of Promoters.
In this article, we show you the NPS formula and provide a downloadable Excel template so you can calculate NPS from your survey respondents.
We recommend that every NPS survey has follow-up questions, to determine drivers. With that in mind, we'll also walk you through how to calculate driver contribution to the overall score.
- Net Promoter is calculated like this: % of Promoters - % of Detractors.
- NPS is a simple average. See it like this: any score 0-6 counts as -100, and scores 9-10 counts as +100.
- It's important to do a driver analysis. A driver contribution calculation determines the impact of real issues on your overall NPS score.
- Avoid recording only one response from each customer account. Aim to get responses from the entire buying committee.
- Careful to create equal weighting between customers. Your score can be biased by those who respond more frequently.
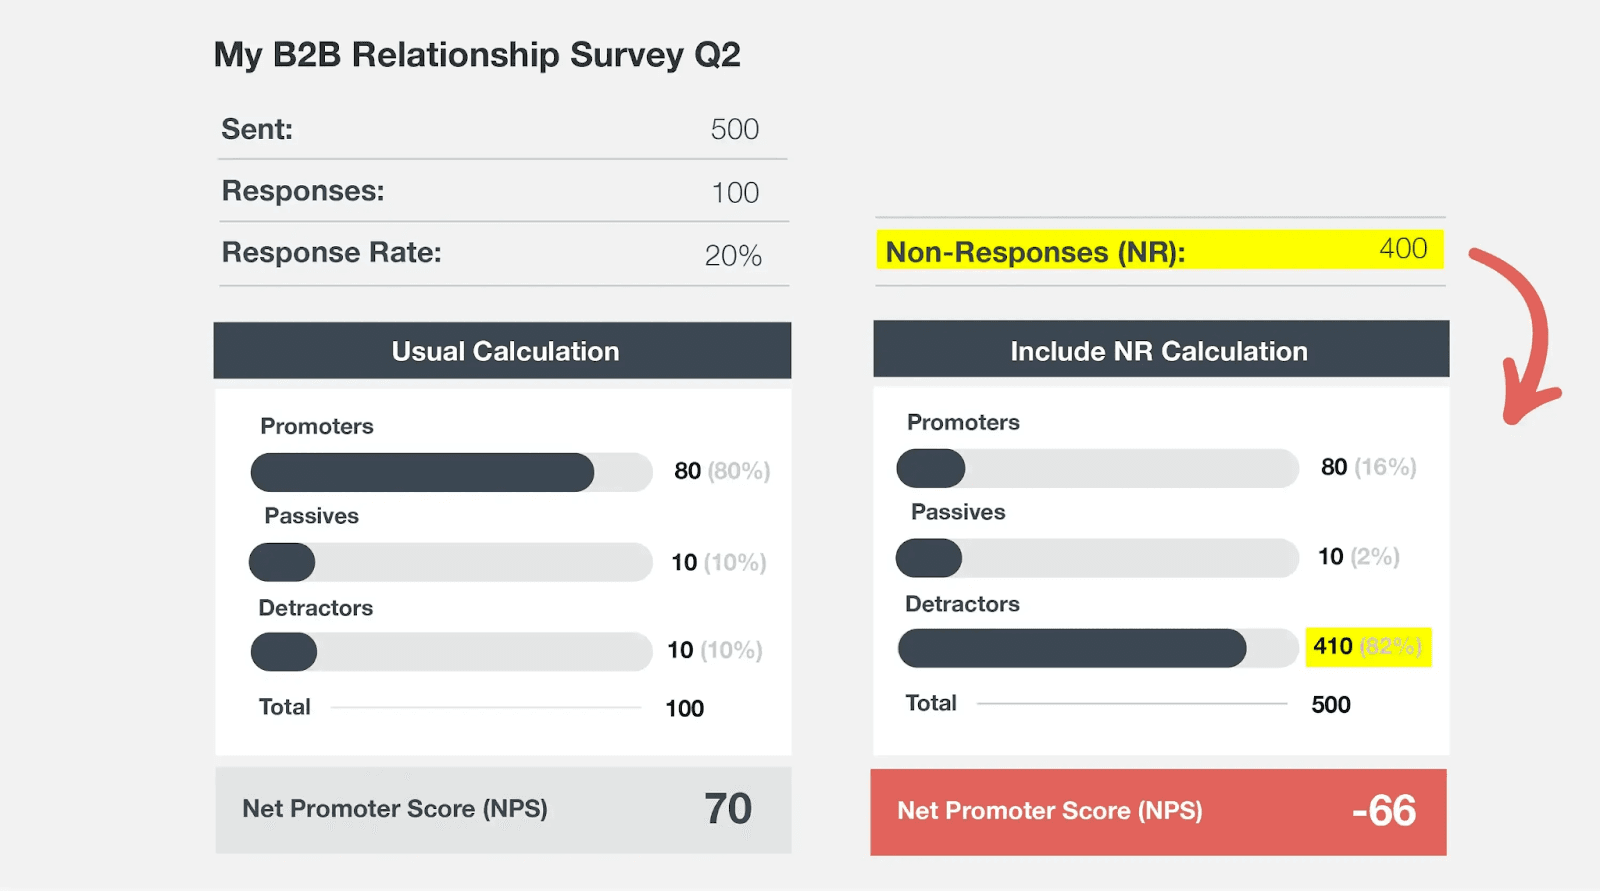
- We recommend that you include non-respondents as Detractors to get a realistic understanding of your customer health.
What is Net Promoter Score (NPS)?

The Net Promoter Score (NPS) metric is proven to measure customer experience and predict revenue growth. Your overall score is found by surveying your customers with one beautifully simple question (although pros ask more than one question, we will come to that later):
“On a scale of 0-10, how likely is it that you would recommend [company name] to your friends, family, or business associates?”
Customers that give you a 6 or below are called Detractors, those who give a score of 7 or 8 are called Passives, and those who give a 9 or 10 are Promoters.
Your net promoter score is calculated by aggregating individual results and measuring the percentage of customers in each group.
When used correctly, the resulting score is a leading indicator for growth because it measures loyalty, and therefore the likelihood of contract renewal and customer referrals.
As you'll see, only Promoters and Detractors are important in the NPS calculation formula.
The NPS Calculation Formula
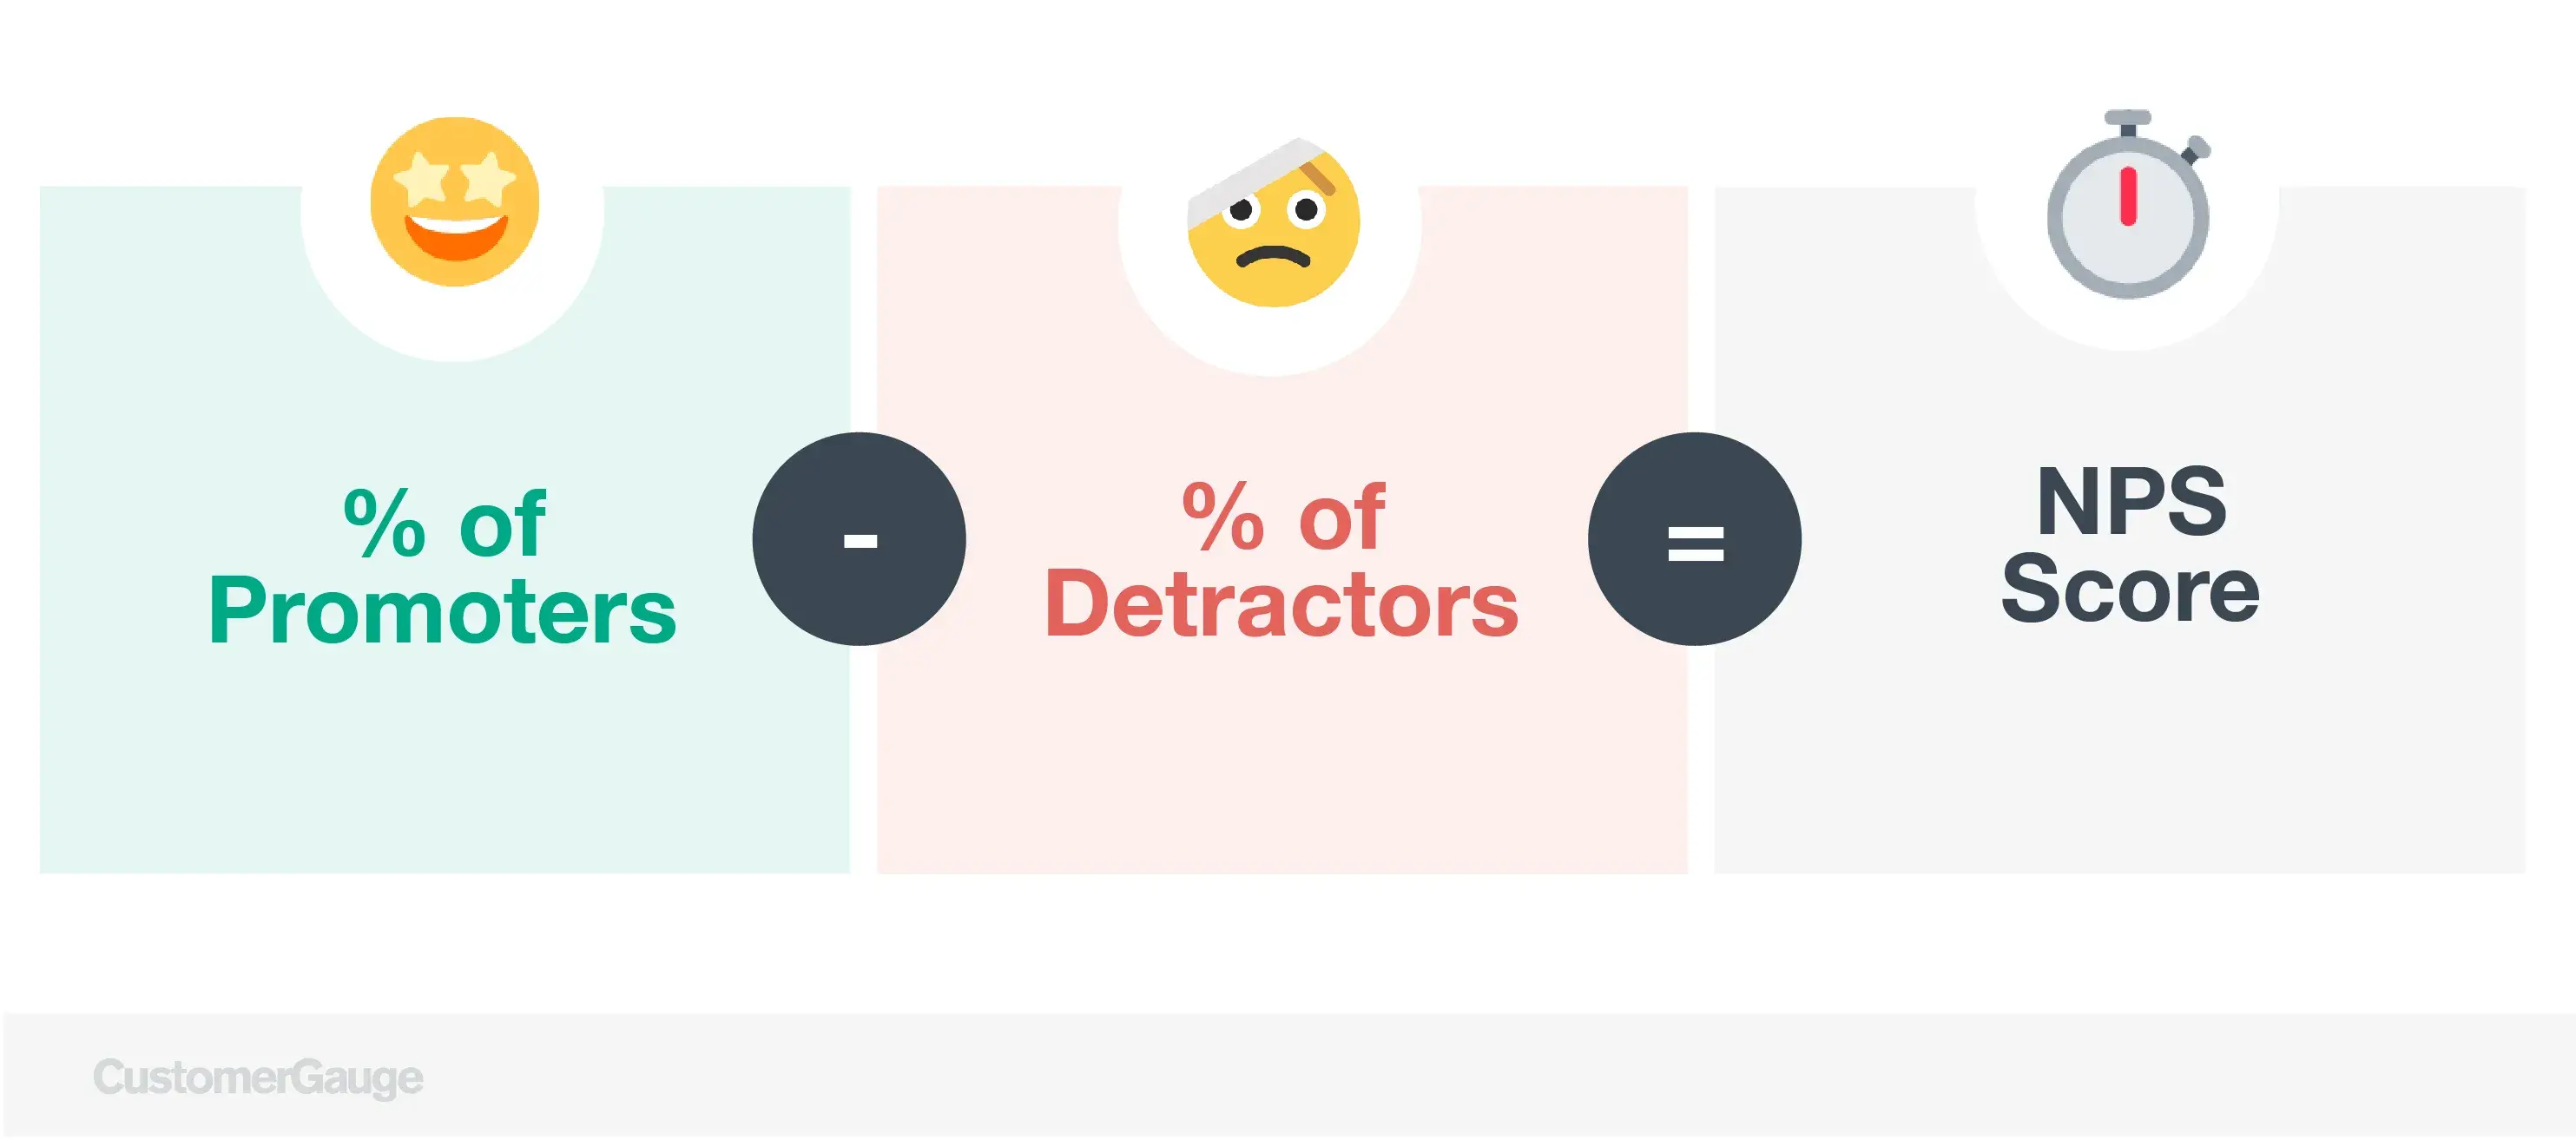
To calculate your Net Promoter Score, subtract the percentage of Detractors from the percentage of Promoters. NPS = % promoters - % detractors.
For example, if 50% of respondents are Promoters, 10% are Detractors, and 40% are passives, your NPS would be 50-10=40.
Use the Excel template below to calculate your score automatically.
Think you're doing well? Here are 40 NPS benchmarks for leading B2B companies.
How to Calculate NPS in Excel [Enter Your Scores in Our Template]
We've created a really simple NPS calculator in Google Sheets for you to use. Copy & paste your NPS survey results in the template below to instantly see your NPS score.
Here's how to calculate NPS in Excel:
- Download the template below
- Download your NPS score data in Excel
- Copy & paste your raw NPS scores
- Read through what happened at each stage
- Note down your result
- Never forget to close the loop
Side note: This guide helps you calculate your NPS score. We have another guide and template if you'd like to calculate the contribution of NPS drivers to the overall score.
Step 1: Download the NPS calculator template
To get started with this step-by-step guide to calculating NPS, download the template here and follow along.👇
Step 2: Download your NPS score data
If you're not using a dedicated NPS software that calculates your score for you, you'll likely have your individual scores in a survey maker like Google Forms.
Export your data into Excel or Sheets to get started. For this template, you want one column of numbers.
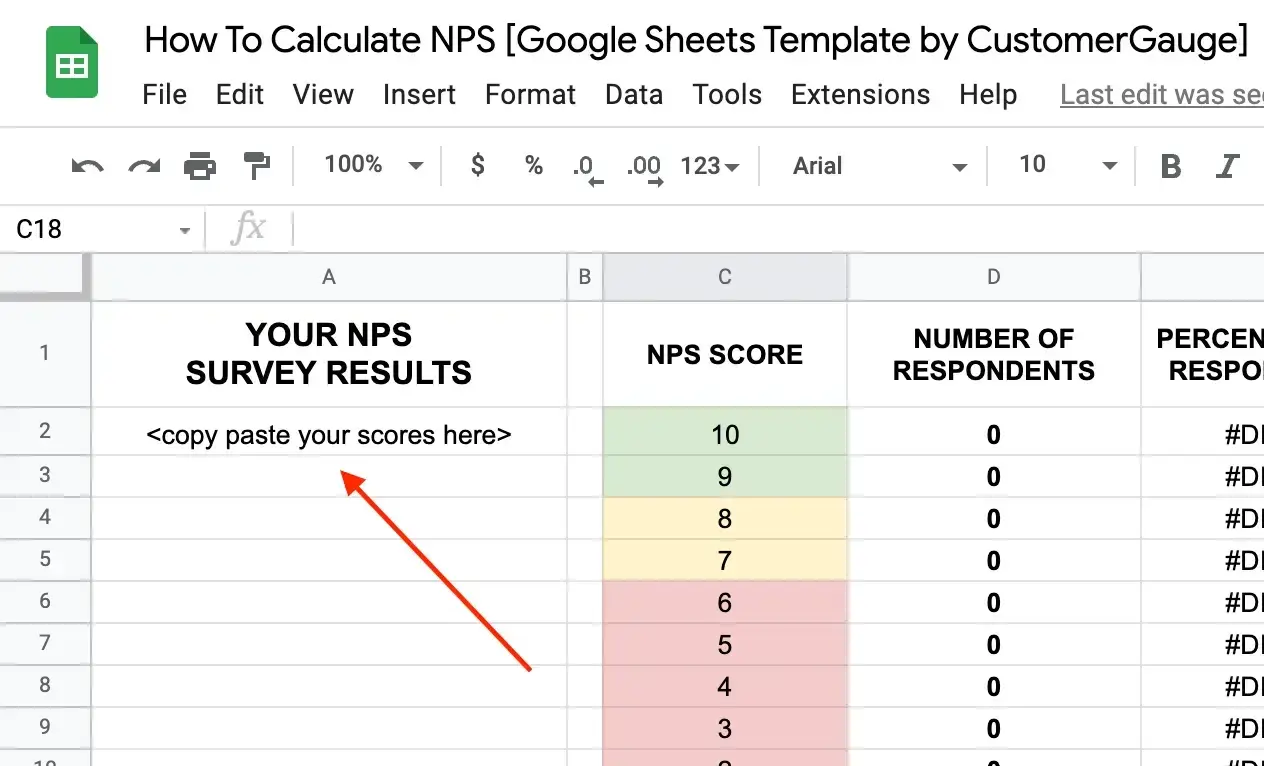
Step 3: Upload your data into our NPS calculator
Copy and paste your column of NPS scores directly into Column 1 on Tab 3 in our template, where it says 'copy and paste your scores here'. There's an example on Tab 2 to guide you.
Step 4: Learn what happened at each stage of the calculation
On Tab 2, read through the quick breakdowns of what's happening at each stage. It's a rather simple calculation!

Step 5: Your NPS has been calculated!
There you have it! In columns K and L you'll find your NPS score. Find out whether you have a good NPS score here. Wait! Don't stop here.
Step 6: Next steps matter more than anything
It's so easy to take your score and parade (or hide) it. But what you do in the next 24-48 is the most critical part of your NPS program.
NPS exists to measure customer loyalty, but it mostly exists to reveal Detractors and show the way to turn them into Promoters (which refer more, buy more, stay longer, and cost less to serve).
Your very next step should be closing the loop with Detractors. If someone has left you negative feedback, how you handle it is critical to retaining them as a customer.
Read our complete guide to closing the loop to learn why it's the best way to increase response rates and turn NPS Detractors into Promoters.
How to Calculate NPS by Driver Contribution
Alongside your benchmarks, an understanding of your score is incomplete without an NPS driver analysis.
Drivers are the motivations behind why customers give you a particular NPS score. These are critical parts of an NPS survey because they show you what aspects of your CX you need to improve.
These can be gauged by adding one of two types of questions to your NPS survey. After the Ultimate Question, ask either:
Open-ended questions. If your customer gave you a high score, ask them “What did you love about your experience with our brand?." This way, you’ll receive in their own words what made the experience so special.
Cascading questions. These are types of survey questions that are presented to customers based on their responses to a previous question. The benefit is that they make your customer responses slightly easier to analyze. Read more here: Why You Should Use Cascading Questions in Your Surveys
Ideally, your drivers will be linked to the different touchpoints in the customer journey, such as purchase, customer support, or delivery.
If you receive a lower score at one touchpoint, you’ll want to know about it.
How Drivers Contribute to Net Promoter Score
In the video below from the CustomerGauge Academy, we take a look at how to determine how much each NPS driver contributes to the overall NPS score.
We deep dive into this subject in our guide to NPS analysis.
6 NPS Calculation Mistakes to Avoid
One of NPS’s greatest strengths is its simplicity. Seeking new ways to calculate your NPS score is done because companies feel they need to have a score that is as representative and accurate as can possibly be.
However, although this has good intentions, it overlooks the fact that NPS is not about knowing an absolute score but is instead about what the score is telling you. Knowing precisely whether your score is -20, 23, or 99 is irrelevant when more pressing is the fact that your customers are telling you they are not satisfied.
Here we outline common concerns raised and new calculation methods we have come across, and why they might not be so important in the long run.
1) ❌ Exclude responses before you start your Net Promoter Score calculation ❌
Suggestion: For business-to-business (B2B) companies, including every response can skew your NPS towards the larger population of end users.
Firstly, having to exclude the results of end users should not even need to happen because they should not have been surveyed in the first place.
When surveying customers, B2B companies should apply the 3x3 model, meaning 3 decision-makers, influencers, and end users.
And while you may have a few more end users and influencers due to their greater numbers, one or two more will not skew the result. Ultimately though, you should only be surveying people that impact future buying decisions; be that end users or decision makers.
2) ❌ Ensure equal weighting between customers before calculation ❌
Suggestion: For B2B companies, your resulting NPS score can be disproportionately influenced by customers who simply responded to your survey in greater numbers. Make sure each customer has equal weighting against each other.
This is another issue that is the symptom of a large problem.
Within B2B, your response rate should be around 60%, and once you have a response rate this high disproportionate influence (such as one company having a response rate of 60% and another 70%) will not matter. You're likely to see that your NPS score, including all responses and the average of company scores, will be roughly the same.
However, it is true that if you have a poor response rate and you let each company have the same weight you certainly will skew the number.
But a poor response rate is not something that should be simply resolved in your calculation, for it is often an indication of poor relationships as non-respondents are usually detractors more than promoters.
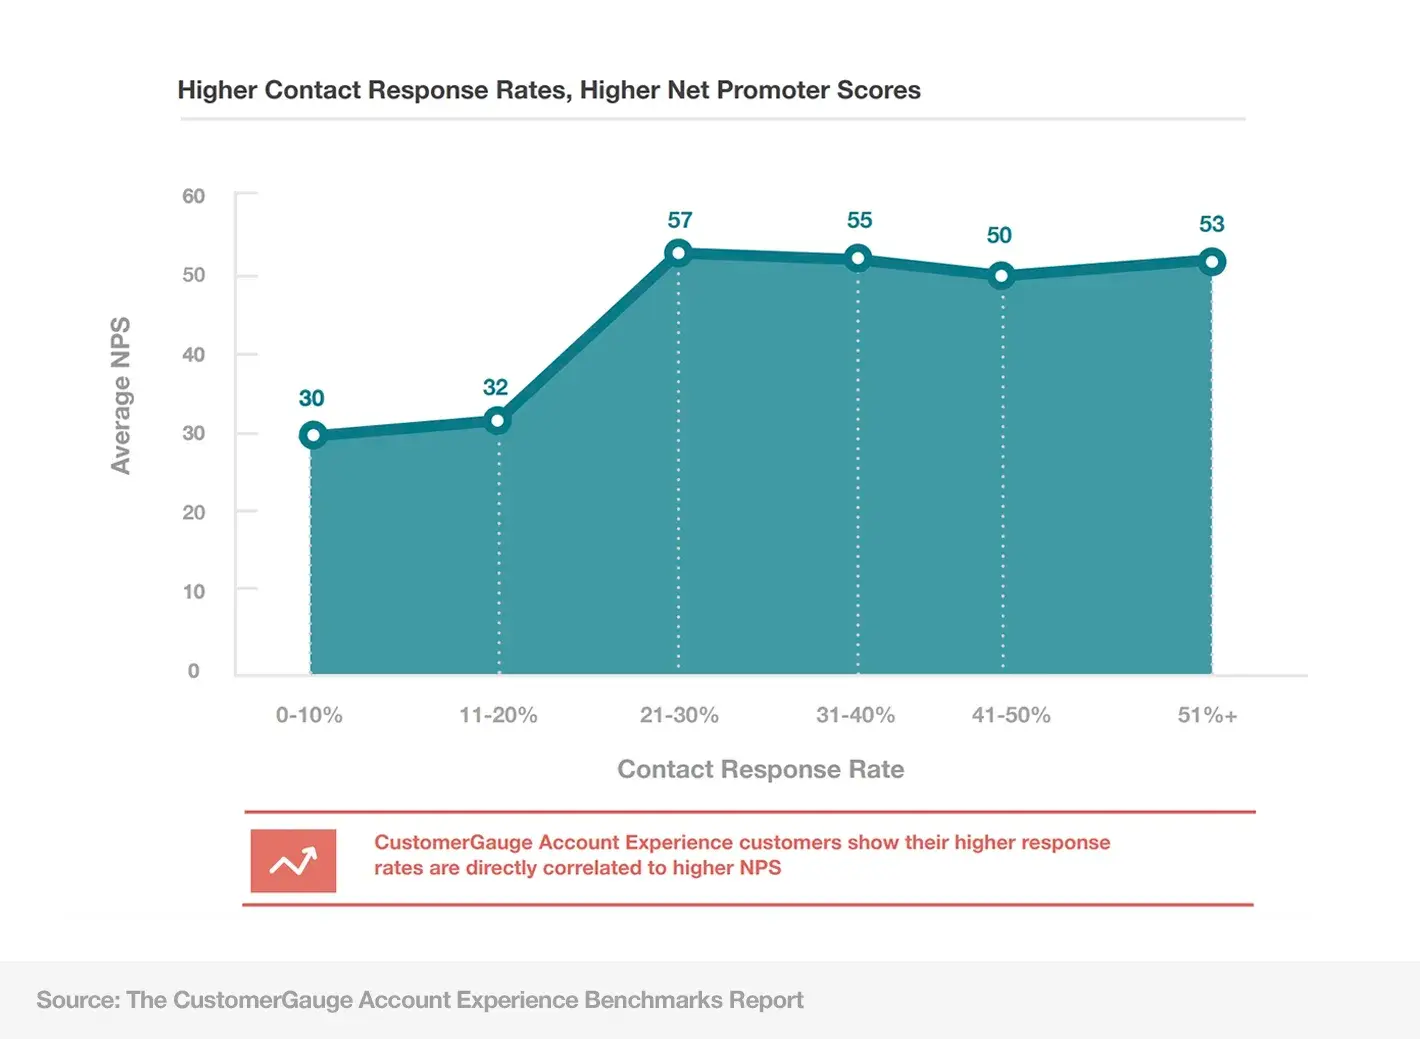
Learn how to increase your survey response rates here.
3) ❌ Derive an average score per customer ❌
Suggestion: Instead of creating equal weighting, derive an average score per customer in order to calculate your overall score. This will mitigate skewing the score toward customers with more respondents.
Almost the same as point (2), except you are calculating your NPS on the averaged scores from each customer. However, this raises a different problem, as it requires you to decide whether 6.5 and 8.5 represent respectively a detractor or a passive and a passive or a promoter
However, as this is the result of the same problem as in (2), you risk skewing your results. If you take an average, you minimize those who didn't respond. Those who didn't respond are likely to be mostly detractors—totally disengaged users—are thus your results will skew positively.
4) ❌ Only record one response per customer in your NPS calculation ❌
Suggestion: Count only one response from each customer towards your overall score. Start with the decision maker, as they have the most influence over a continued relationship. If the decision maker doesn’t respond, the score from the next most important person should be counted. This type of approach avoids overweighting concerns.
This one is particularly erroneous, as neither a B2B relationship nor a company’s score should be based upon the feedback of one employee.
Here, the desire to create a precise score forgoes an understanding of the health of each customer relationship. No B2B relationship should be based on one decision maker, for the future of any continued relationship (contract renewal, upsell opportunity) is also dependent on influencers and even end users.
Furthermore, decision-makers are often not initiating purchases so by using only a decision-maker in your calculation, the NPS does not reflect your likelihood to sell again.
5) ❌ All differences are important ❌
Suggestion: In general, no matter what type of differences exist in your surveyed customer base; your Net Promoter Score should take all nuances into account when calculating your score.
This is really not as critical as you think.
Relational NPS is an indicator of the health of your business. It is a great way to track customer satisfaction trends, be used as a KPI, and be shared amongst a company as a means of motivation, but these have nothing to do with the calculation method.
What are the customer experience facets you are falling behind on, what can be done to improve the experience, and have your previous measures made the experience better?
Complicating your NPS with new calculations doesn’t make it any more accurate and fails to answer the questions above.
6) ❌ Don’t ignore Passives and Non-Respondents ❌
In our article on NPS improvement ideas, we said this:
"If you’re only focusing on Detractors and Promoters, your NPS score will reflect that.
Your natural instinct is to jump on Detractors and ensure you’re closing the loop with them, we get that.
However, the creator of NPS himself Fred Reichheld, suggests you should always consider Non-Respondents as Detractors and continue to monitor Passives — an absence of signal should be considered a high-risk signal itself.
This will provide you with a realistic understanding of your customer health."
This is super important. Take a look at the impact on your NPS score if you assume non-respondents are Detractors:
To Remember When Calculating Your NPS Score
Remember, calculating relational NPS only includes the latest survey results from each customer.
So, if you score poorly with a client this should act as an incentive for employee buy-in, to work harder to improve the relationship and measure this in the next round of surveying.
Do not get bogged down in whether there is something skewing the result or not.
As a vendor ourselves, we know that many companies are always looking for NPS benchmarks.
If you wish to compare yourself to vendor benchmarks, stick to NPS’s standard calculation otherwise any comparison between yourself and other companies has no meaning.
However, if you really do find yourself in need of choosing a different method of calculating NPS, then stay true to it. Benchmarking yourself against other companies may not be possible, but more important is the fact that you can compare your own result year-to-year.
Creating a Reliable and Actionable Net Promoter Score with CustomerGauge
Your Net Promoter Score is only as good as the survey it is based on.
Question-heavy surveys hamper response rates, confuse respondents, and leave employees confused about how to interpret results.
Designing and conducting a Net Promoter survey does not require a long planning process. At just three questions long, the survey can be designed in one day and sent out the next.
Don’t worry about surveying all your customers or designing a survey for each division of your company. Start small, so that you get moving fast.
Use a simple relationship survey on a select group of customers to show upper management how fast it is to identify customer experience weaknesses and create a Net Promoter Score.
Ready to learn more? Take the next step and see our product live with a demo!
About the Author