6 Most Popular Customer Experience Metrics and KPIs Explained Simply

Last updated on February 12, 2024
According to The State of the Customer Experience survey that we conducted earlier in 2018, all companies track customer experience using one or several of the 6 worldwide recognized customer experience metrics: Net Promoter Score (NPS), Customer Satisfaction (CSAT), Churn rate, Retention rate, Customer Lifetime Value (CLV), or Customer Effort Score (CES). The survey findings also highlight the increasing importance of leveraging AI in customer experience management, incorporating strategies such as text analysis, customer experience strategy templates, and the analysis of customer surveys to gain deeper insights into customer sentiments and behaviors.
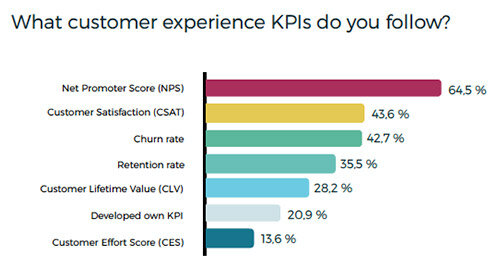
You can easily see that NPS is the most common CX metric: almost two-thirds of companies follow it. The churn or retention rate is usually used to understand the connection between customer experience management and its monetary value, further emphasizing the role of AI-powered customer experience analytics and text analysis in interpreting data for actionable insights. This is particularly relevant in the context of using rating scales and structured feedback analysis to enhance the understanding of customer satisfaction and loyalty.
Let’s dive deeper into each of them, recognizing how the integration of advanced technologies and methodologies, such as text analysis and AI, into the analysis of traditional metrics like NPS, CSAT, churn rate, retention rate, CLV, and CES, can provide companies with a competitive edge. This approach not only helps in tracking and improving customer experience metrics but also aligns with the broader business objectives by effectively managing and enhancing the customer journey through strategic insights gained from customer feedback and, conversational and behavior analysis.
Three Customer Experience Metrics
The Customer Experience Metrics are the KPIs the business follows that involve customers’ input. These metrics help you in understanding how loyal or satisfied your customers are. The most popular customer experience metrics include Net Promoter Score, Customer Satisfaction, and Customer Effort Score. Use an NPS survey to track customer loyalty over time, send out CES surveys to understand how easy it is for customers to get the support they need, or distribute CSAT surveys to understand how satisfied customers are after key touchpoints in the customer journey.
Net Promoter Score (NPS)
As you could clearly see from the graph, NPS is the favorite customer experience metric among Nordic companies. The same applies also globally. About two-thirds of all companies are using it to define where they stand in terms of the customer experience. Since 2003, when the metric was first introduced, NPS has been gaining popularity. Now, most Fortune500 companies, incl. Apple, and other global market leaders, incl. Airbnb, benefit from the metric. Why?
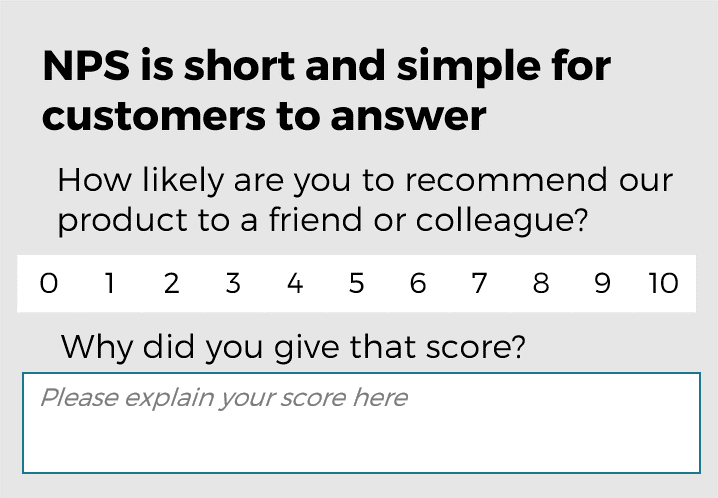
NPS is short and simple for the customers to answer and it is very easy to track for companies. NPS consists of only two questions and it gives that one customer experience-related number your leadership needs for target setting and bonuses. NPS is often used to rate a brand, service, or product in general.
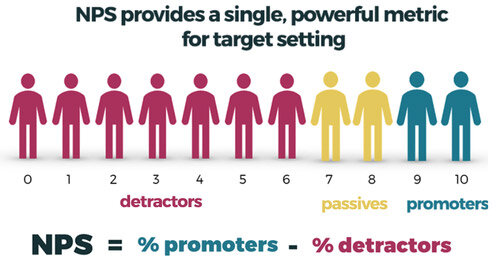
How to calculate NPS?
-
Calculate the percentage of promoters among your surveyed customers
-
Calculate the percentage of detractors
-
Subtract the detractor percentage from the promoter percentage
In short, why should you use NPS?
-
fast, simple, and easy both for customers and companies
-
open text feedback allows us to dive deep and see the big picture
-
industry-standard metric: it is widely understood and benchmarks exist(before benchmarking, read what NPS score you should aim at here)
-
an increase or decrease in NPS helps you to predict future revenue gain or loss
-
NPS is also utilized to measure word-of-mouth marketing strategies
If you want to know more about NPS, check this comprehensive guide to the Net Promoter Score for more details.
Customer Satisfaction (CSAT)
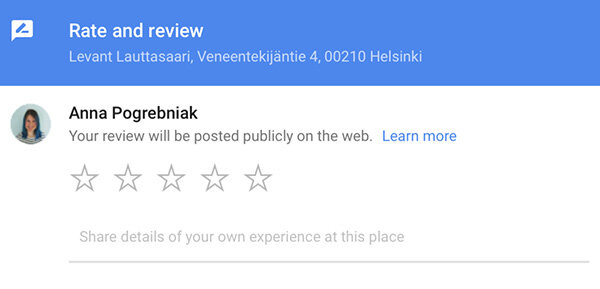
CSAT, together with NPS, is one of the most used CX metrics. It has many forms and scales, but the most common is a scale from 1 to 5. Google or Facebook ratings are a good example of CSAT.
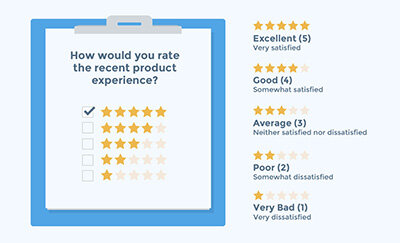
CSAT is a very good tool if you want to measure if a customer is satisfied with one-time interaction. It is most often used in customer service (or customer support). CSAT can also easily adapt to the particular needs of your organization.
Why use CSAT?
CSAT is a very simple and efficient customer experience metric to implement. Just as the NPS, it’s typically very simple and fast for the customers to answer. It is often asked from a customer after a transaction or customer support ticket to evaluate the efficiency of the customer service department. CSAT is a great way to see what your customers think about you right now.
To read more about customer satisfaction – check out this article: The Importance of Customer Satisfaction
Customer Effort Score (CES)
Customer Effort Score is the third most popular customer experience metric that involves the customer’s input. CES is a pure transactional metric and it typically assesses the simplicity of a single solution.
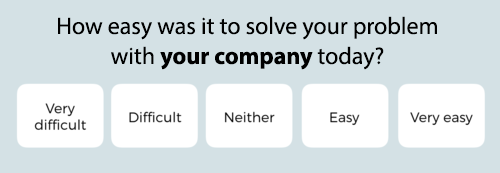
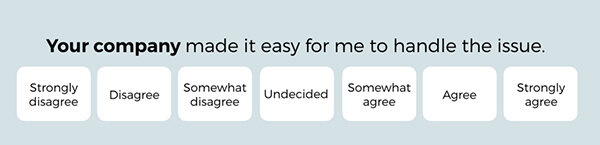
CES typically answers “how easy was it to solve your problem with today?” and has a 5- or 7-point scale system. Below, there are some examples of CES implementation.
CES is different from NPS or CSAT because, in order to make sense of it, you need to follow both the average score and the distribution of scores. Analyzing distributions could help you in identifying which of your customers experience effortless service and, more importantly, find those that struggle to during the process. By proactively helping and reaching out to those who are struggling, you can effectively decrease churn.
Why use CES?
CES helps you to analyze the complexity of the service. Why is it important? 94% of customers going through an effortless experience are likely to repurchase vs. only 4% of those who went through a high level of effort. According to the same research, 81% of customers going through a high level of effort are likely to share their bad experiences with friends vs. only 1% of those who went through an effortless experience. An interesting discovery is summed up in HBR article “Stop Trying to Delight Your Customers“ – companies create loyal customers not by “wowing“ them, but by providing an effortless experience.
Sue Duris, Director of Marketing and Customer Experience at M4 Communications, strongly believes in the connection of CES, loyalty, and the direction the company is going. “CES is a transactional metric and should be used after service interactions and other key moments of truth like after purchase. Loyalty is about whether a company can deliver – does it meet/exceed expectations? Reducing effort has been found to drive loyalty. What CES does is that it measures an ability to reduce friction/improve ease of use. That’s why I believe CES is the best metric to predict loyalty.”
CES is a good metric for revealing detraction drivers. With NPS and CSAT you most likely get a more balanced view: not only your weaknesses but also your strengths. Using any one of them is useful to understand the customer experience.
Churn rate
The customer churn rate reflects how many of your customers have stopped using your products or services. Generally, customer churn rate counts the total number of lost customers or the percentage of lost customers within a defined time period. Sometimes, the customer churn rate is calculated as a lost business value.
For example, you have signed 1000 long-term contracts of a value of €100 at the beginning of the year, but now only 800 of those customers keep using your services. Depending on different ways to count your churn rate, it could be either 20%, 200 customers, or €20000.
Following the customer churn rate is critical because generally, it is much less expensive to retain existing customers than it is to acquire new customers.
Reading recommendation:
What customer churn is and how to calculate it
3 Ways to balance between acquisition and retention
Retention rate
Customer retention rate is the measurement of how a business retains customers over a specific period of time. The metric is highly connected to the churn rate: the higher the retention is, the lower the churn rate would be. For instance, if your churn rate is 10% over a year, that means that 90% of customers stayed with your company. Thus the retention rate is 90%.
If it doesn’t make you work on your retention strategy just yet, think about this: loyal customers are 5x as likely to repurchase, 5x as likely to forgive, 4x as likely to refer, and 7x as likely to try a new offering, according to Temkin Group.
Reading recommendation: How to measure and improve customer retention
Customer Lifetime Value (CLV)
Customer Lifetime Value (CLV) is a prediction of the net profit attributed to the entire future relationship with a customer. CLV could be calculated both as a business value that the customer brings during the whole time of the relationship with a company or as a value over a defined period of time (a year, 5 years, or anything else that makes sense to the particular company). It is usually looked at as an average. For example, it might be easier to calculate the whole CLV for a wedding planning company (people don’t get married too often) but it makes more sense to calculate a year CLV for a soda producer.
Check this article by Hubspot to find out more about calculating CLV.
Customer Experience-related business KPIs
Understanding the customer voice via customer experience analytics is a crucial step toward building a successful customer experience management approach. At the same time, all CX metrics need background information on the operations. When you can link the customer experience metric results to what happened in the transaction, you can better assess which levers to pull to influence the happiness of your customer.
The operational KPIs could be anything from typical customer engagement metrics or speed of service to the average queue time in the shop – anything that can affect your customer.
It is good to stay on top of your key operational measures. Just keep in mind that you also need to listen to the customer to really understand how they experience the situation. The queue time can have a strong impact on how people perceive your customer service but it is not the only determining factor.
In addition to the customer voice and the related customer experience metrics, it is crucial to understand how the customer experience impacts customer behavior and – because of that – your business. To understand this, companies typically measure some critical behavioral loyalty metrics, most typically the churn, retention, or customer lifetime value.
Should you measure all the metrics?
The answer is no. You should measure the ones relevant to your business. Also, you should not ask your customers to give you feedback before you understand what you would do with it.
Most companies measure on average 2.5 customer experience-related KPIs. For your business development, we recommend you understand your business metrics (churn or retention and CLV) and the appropriate customer experience metrics. In practice, find the metrics that do make sense to your business. Most companies are best off when they choose one customer experience metric and one related behavioral metric. Adding more complexity doesn’t typically add value. On the contrary, having a simple survey design, proper customer feedback analytics and a simple set of targets and metrics to follow up helps the organization to focus on things that matter: fixing issues and improving the results.
Read here about how to establish customer experience goals and targets for your company.
Nate Jones, Director of Customer Support at SimpleNexus states the common problem among businesses: over-measuring. ”No matter which metrics you choose to use, make sure they are predictive of the outcome you are trying to avoid or promote. Too many businesses gather the metrics because they feel like they are supposed to and don’t understand how to get the value out of them.”
The advice is clear. Don’t measure for the sake of measuring. Measure to grow your business.