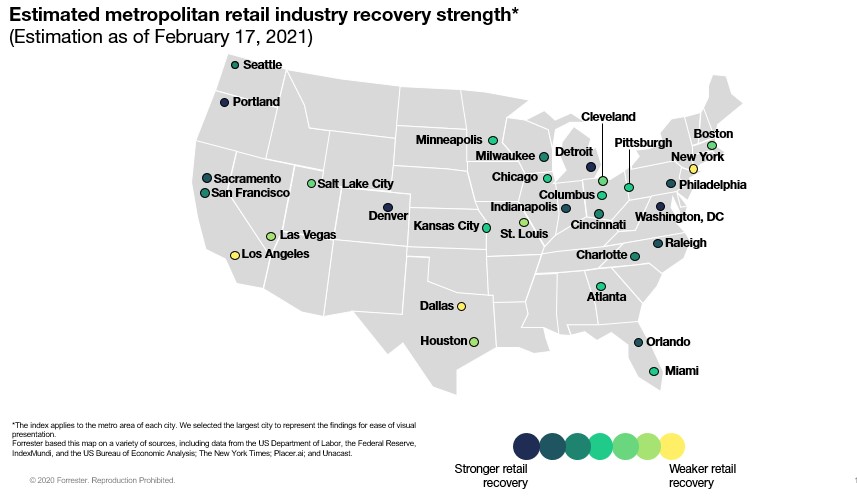
Promising Improvements — Forrester’s US Retail Recovery Heat Map, February 2021
Since April 2020, we have estimated how the retail economies of 30 major US metropolitan areas are recovering from COVID-19. By aggregating 11 metrics (across retail sales, local economic indicators, and virus spread), our model predicts that these metropolitan areas will face differing levels of COVID-19 disruption. For these metrics, we looked at US metropolitan-, county-, and state-level data on:
- Prior dependency on retail. We looked at retail sales per capita, retail sector employment per capita, and estimated retail GDP.
- Severity of the COVID-19 outbreak. We looked at the size of outbreak per capita, per capita deaths due to COVID-19, how fast cases are increasing, and the number of new unemployment filings.
- Remediation efforts. We looked at estimated social distancing data, foot traffic in retail locations by state, and how proactive the stay-at-home orders were in each city.
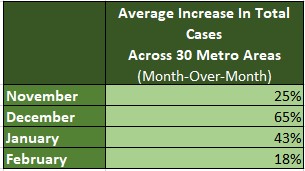
While each metro area has its own peaks and troughs, we have seen two national peaks — one in spring 2020 and one this winter. It appears that in February 2021, there are promising signs that we are on the downswing from the winter peak. In the 30 metro areas we examined, we found that the average month-over-month increase in COVID-19 cases is the lowest it has been since November 2020. Additionally, US retail sales grew 5.3% in January, which was the highest increase in seven months.
Although there is positive news at the US national level, metro-level retail economies are still seeing varying levels of recovery. This month, Dallas, New York, and Los Angeles are also in our “yellow” (i.e., weaker retail recovery) zone. At this point, these metro areas have high per capita levels of daily infection, as well as high unemployment.
If you would like to see the data behind these metrics or see more metropolitan areas, please contact your Forrester account representative, schedule an inquiry with me, or email Madeline Cyr, researcher, at mcyr@forrester.com.