
We just finished teaching a CX-driven Customer Journey Mapping class to a large and very diverse group. It was really a fascinating class – smart and discerning. There were a number of common questions and comments from both beginning and advanced CX Architects/Mappers.
These following questions got me thinking:
We are B2B, so we are more complex than B2C, aren’t we?
We are a startup, so our maps are simple, aren’t they?
How complex do our maps need to be to get something out of them?
So I went back to look at what we have done – similar to what we did when we looked at approaching mapping and looked how clients (and we) ended up and found out (no surprise) that ‘it depends’.
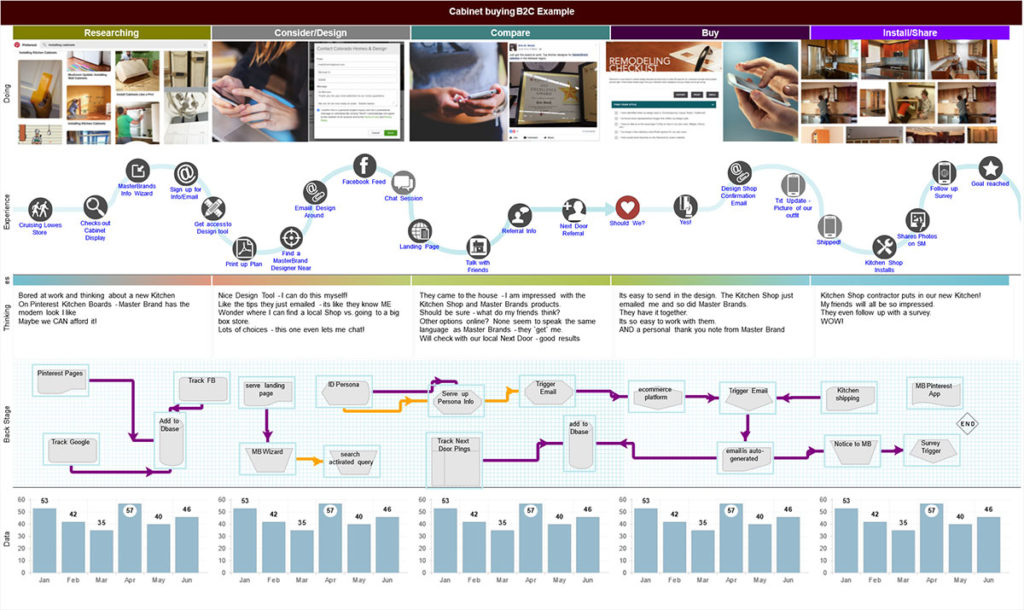
We build maps like ‘layer cakes’ – the technique is similar to agile sprints or six but it’s basically adding a layer at a time to expose more and more information without junking it up too much.
Check out this guide to learn how to build your own Customer Journey.
Do B2B and B2C maps really differ?
Let’s talk about the customer layer (front stage) first. We have found that B2B or B2C tend NOT to be the differentiators. A straightforward brokerage house with only one or two major client types and a streamlined operation (backstage) is far simpler than an Omni-channel retail organization with lots of unique personas simultaneously using multiple touchpoints or a Utility with intermediaries performing actions on your behalf.
The majority of customers have similar objectives in dealing with their providers. In general, they want simple. They want to find what they want fast –with low effort – right on target for their need – with low drama and then they want the relationship to be prescient and pretty much invisible unless they need something. Maybe they will provide feedback. So a map of that is pretty straightforward…
Having said that, there can be a lot of other variables applied that can add complexity:
- The most impactful is the number of interactions required for customers to achieve their objective (learn/buy/fix/rebuy/give feedback etc.) News flash – this is largely directed by how you choose to do business!
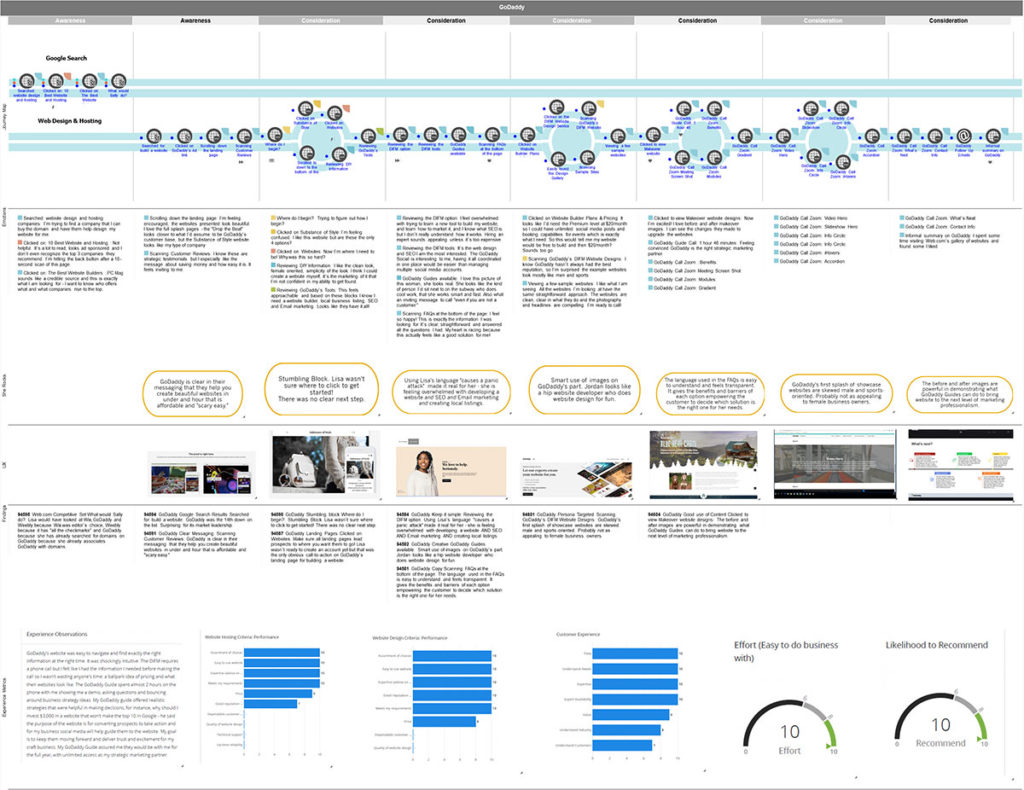
- Addressing different Segments/Personas – try to put these all on one map and – wow – complexity!
- Number of Channels/Media – same here – even with the major touch-types – digital/call center/Store/Field person/mobile there can be lots of variation. Same here! The more channels you have the more complexity that is introduced.
- B2C Companies with intermediaries like Call Centers and/or Field services by nature also are more complex as information is parlayed between many groups.
- Putting in Happy/Unhappy paths when done on the same map also creates visual complexity
- Add a layer for VoC/VoE and one for key initiative call outs; one for visuals such as marketing artifacts or visuals and attach supporting data and now you have a visually complex map!
- Planning for digital transformation and the need to understand touches and how they relate to GDPR or CCPA can help make your maps more multi-purpose.
By judiciously adding information or using multiple maps to focus in on and highlight each factor, you can stop right here and have a perfectly good map helping to describe the customer without needing a guide dog to present it. You can also reduce complexity by zeroing in on what you want to know. There is no law that says you can’t just map a problem area or assess a particular product or service experience. It is a good practice to have a baseline at some point to nest all the one-offs but given today’s time and resource constraints looking into a place where feedback is negative or a transformation is required is just the ticket.
Now comes the hardest part. The company side (backstage) layer that documents what is creating a pain point for your customer is where complexity can and usually ramps up. Just mapping a service blueprint by People/Departments/Process/Data/Technology can look like spaghetti on the wall if not rendered simply to start.
We find that again, B2B and B2C aren’t really the key elements. It’s your processes, integration, handoffs and frankly how many unaligned departments you throw at the customer that creates messy maps (and unhappy customers)!
In B2C, the lifecycles/departments/channels tend to be a bit more aligned than in B2B and for B2C. That’s why they seem to be a bit simpler.
In B2B, where you may want to document the different buyers and influencers as they try to work through your Demand Generation Marketing/Sales/Sales Operations/Operations/Marketing Operations all in the same lifecycle – this is where B2B IS different and has an outsized impact on complexity – especially if the departments and their data/automation aren’t really hand in glove.
Stepping back here and using color-coding or going up a level in detail helps gets you to the summary level. That’s a big step forward to see the big picture.
Once you have done that you can drill into smaller scenarios to spread out the time and add in other interactions; Voices and metrics/scores.
Some key takeaways:
- Maps are as simple or as complex as you choose to make them. One thing for sure, trying to do everything in one map will make it really complex and less helpful than it could be.
- Detail isn’t always complexity – especially if you start to see themes. Just don’t cram it into one map. Using colors and images makes a big impact here.
- Look at the variables you have in your company – parse for them as well. More than one map leads to more insights.
- Don’t assume complexity (or not) – map with an objective in mind and let it expose information.
- Create taxonomy of maps so you have levels – summary – drill down – deep drill – specialty (persona/channel/department/MOTs, etc.) That way you end up with reusable and updated maps vs. ”stuff”.
- Have fun with it – maps and storytelling are interesting group efforts
- The key takeaway is to identify specific actions that need to be taken to improve the customer experience and drive more sales, reduce churn, etc. Tie your findings to the business outcomes so you can engage management and those effecting desired outcomes.
Share this Post