What Causes Consumers To Keep Using Your App? Three Key App Features Stand Out
What is the secret recipe for creating an app that users open day after day? We used our Technographics® 360 methodology, which combines data sourced from the same group of individuals via behavioral tracking, online surveys, and our market research online community to answer this frequently asked question.
What did we do?
First, we asked participants questions about a randomly selected app they use, including how they discovered the app and how strongly they agreed with statements regarding specific app attributes, such as whether it was easy to navigate. Next, we took the responses for each participant and merged them with their behavior on that particular app. Finally, we engaged our participants in a qualitative project to expose the reasons behind our results.
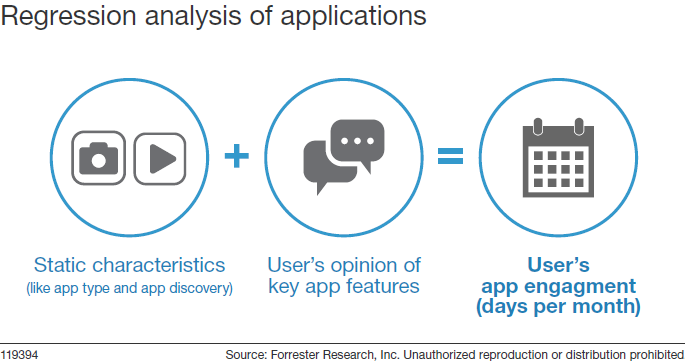
This powerful approach allowed us to align a single participant’s behavior, personal characteristics, and attitudes to uncover the key attributes that lead to increased app usage. Perhaps not surprisingly, we found that apps generate varying levels of engagement simply due to the type of app they are: Consumers access gaming apps more frequently than they access travel apps, for example. So we quantified and removed the effects of app type and other static characteristics that influence usage. This allowed us to isolate the relationship between users’ opinions of app features and their engagement with that app.
What did we learn?
Using advanced analytics, we identified three groups of features that increased the number of days a user accesses an app:
1) Fulfilling a tangible need for the user and being the first app to do it.
2) Easy navigation within the app and simple controls.
3) Entertaining elements within the app.
Technographics clients can download my latest report, Three Key Features That Increase App Engagement. Read it for examples of apps that have successfully incorporated these features as measured by users’ opinions. Learn how to prioritize the features in your own app by identifying those with the largest positive impact on your app’s audience engagement. For example, fewer than half of shopkick’s users agreed that the app was easy to navigate. Improving this share to 80% could lead to consumers using the app an additional 13 million days per month!
Nicole Dvorak is a data scientist serving all roles. Follow her on Twitter at @NicoleLDvorak