
Quick Guide: How To Measure The Accuracy Of Feedback Analysis
When you consider using a new customer feedback analysis software, you’ll need to make sure that it’s feedback analysis capabilities are accurate and reliable.
At Thematic we take accuracy seriously. We evaluate accuracy on every single dataset, and our approach depends on how much time is available.
There are three main approaches that you should consider to measure the accuracy of your feedback analysis.
Eyeballing [Easy Review: (1h)]
Eyeballing the results: We use this approach at Thematic for every customer.
First, we try to get to 80% of comments tagged and a maximum 20% untagged, although it depends on the dataset.
Second, we use our solution called Themes Editor to tweak the results as needed, to get close to 100% accuracy.
Below we share how we eyeball the results during this tweaking and refinement process…
Are the discovered themes meaningful?
Review all themes and their subthemes, along with sentiment.
Can you say “and therefore” after each theme to determine what you would actually do about it.
| ✔ 10% of customers talk about | “difficult navigation” | and therefore we need to review the layout of the site. |
| ❌10% of customers talk about | “UX” | and therefore ?? |
At Thematic, we only use themes like “UX” as categories to group other themes.
Are the themes precise?
Here are the process I use to test this:
- Download all results into a spreadsheet
- Sort by theme
- Scroll down and read responses by theme
- Ask yourself: Are the responses about the same thing?
When grouping them all in this way, it’s easy to spot how precise the themes are.
Are ALL comments tagged with themes?
In the same spreadsheet, scroll to the “Other” category. What’s the percentage of untagged comments? Are they rightfully untagged?
By sorting again alphabetically by comment, it’s easy to spot themes that have been missed.
Side-by-Side Histogram [Medium-Effort Evaluation (3-5h)]
This approach is most commonly used by Thematic customers when they evaluate whether to use us or not. Most commonly the answer is yes! :)
- Take a sample of data (e.g. 1000 rows) and manually analyze feedback.
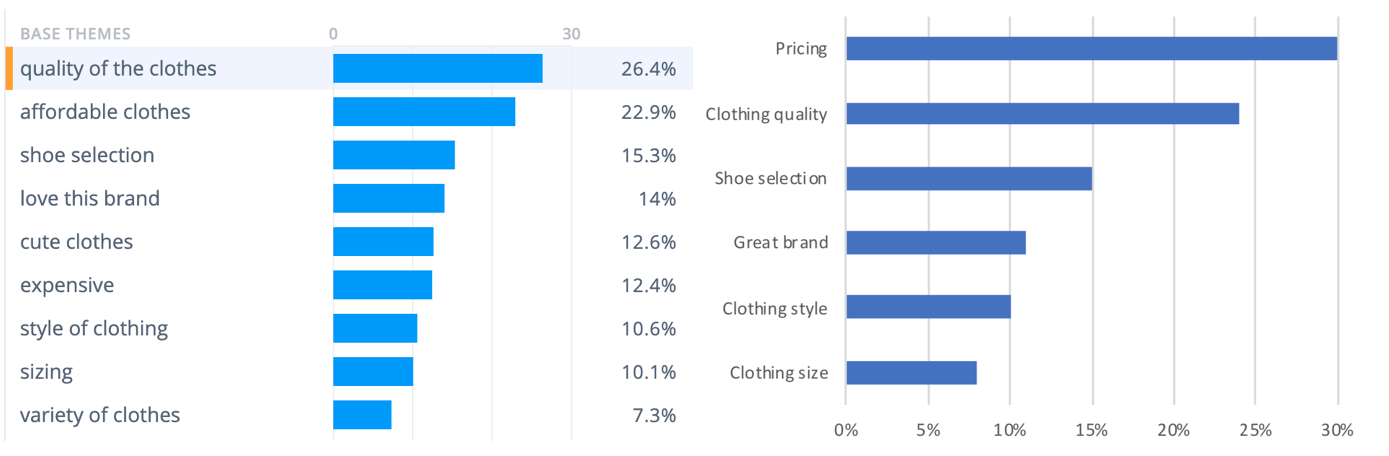
- Create a histogram by sorting all themes by volume from both manual and automatically determined themes
- Compare the results side-by-side. Is the order of themes the same or similar?
Please note that you might need to take into account that one major theme in one dataset is represented as two separate themes in another.
In the image below, the histogram on the left lists “affordable” and “expensive”, and the one on the right combines them as “pricing”.
In step c, you can either use the eye-balling technique, or calculate consistency as described in the next section.
Calculating Consistency [Advanced Evaluation (1-2 days)]
We have written about this topic before in our article on how to measure accuracy of coding surveys and an accuracy study of coding responses to open-ended questions.
You will need to either use an Excel file or write a script (Python and R are great for this).
Given two sets of themes A and B, you will need to calculate the consistency as 2C/(A + B).
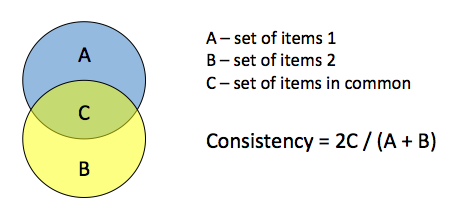
This formula returns 0 if the two sets have no overlap, and 1 if they are identical.
For example, let’s say a piece of customer feedback is represented in this survey comment:
“I was impressed by how friendly the person on the other end of the line was. They resolved my problem fast and efficiently and made sure I received a refund. But I’m disappointed that I had to wait for two weeks for the refund.”
| A = Manual themes | B = Automated themes | C = themes in common |
| friendliness, call center, refund | friendliness, efficiency, customer service, refund | friendliness, refund |
| 3 | 4 | 2 |
Consistency of these two theme sets is 57%, calculated as follows;
2*23+4=47=0.57
You could continue to evaluate the consistency of themes each piece of feedback at a time, and then average the results.
Or, you could calculate the consistency across the most frequent themes.
It’s important to have an approach that gives you the confidence that you’ve chosen a solution you can rely on. Choose between an easy, medium-effort and advanced evaluation depending on whether you have a couple of hours of time or a couple of weeks. You could even automate some of this by using a script, but you will still need a person to make the judgement of whether the results are sufficiently accurate for what you are trying to achieve.


